

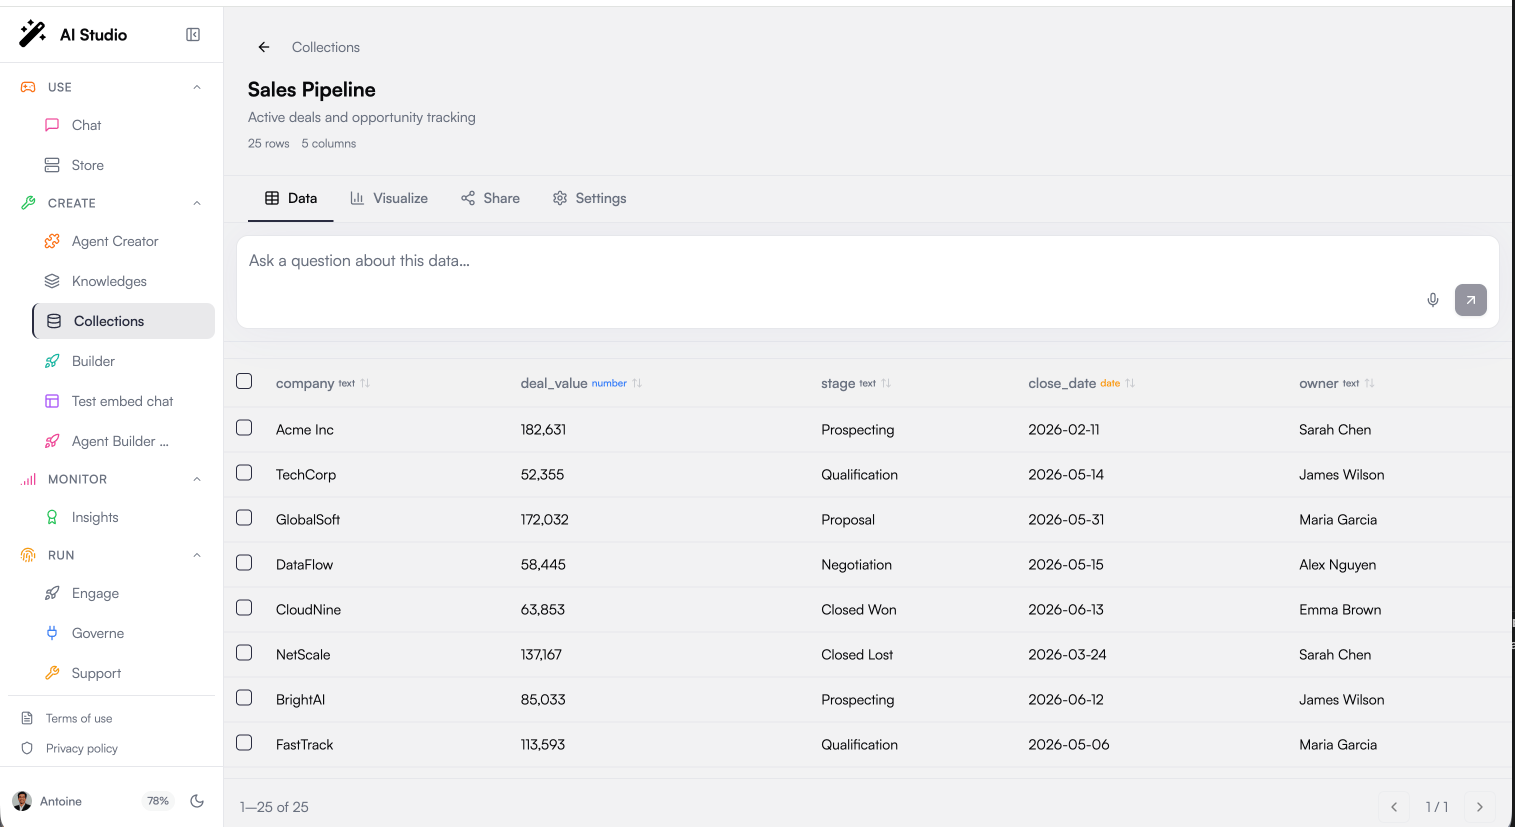
Reading the Table
Each column header shows the column name and a type badge (text, number, date, datetime, boolean, url). Values are formatted according to their type:
Structured values (nested objects) are displayed as JSON.
Asking Questions
Above the table, the Ask bar lets you query the data in plain language (“how many deals are won above €10k, by stage?”). The answer comes back as a short written summary plus, when relevant, a chart or a KPI computed from your data, the same exact aggregation engine agents use, not a guess.Adding and Editing Data
- Add row: opens an inline draft row with a field per column, using the right input for each type (a checkbox for booleans, a date or date-and-time picker for dates, a number field, …). Save to insert the record.
- Add column: adds a new column to the schema (name + type). New columns are optional and appear immediately.
- Edit a cell: click any cell to edit it inline; press Enter to save or Escape to cancel. Datetimes are entered in your local time and stored in ISO 8601 (UTC).
Editing is available when you have write access. On collections you can only read (or in the demo), the table is read-only.
Sorting
Click a column header to sort ascending; click again to sort descending. The active sort is shown with an arrow (↑ or ↓) in the header. Sorting applies to the whole collection, not just the visible page.Navigating Pages
The table is paginated so large collections stay fast. At the bottom:- Move between pages with the ◀ ▶ arrows
- See your position with the “X-Y of total” counter and the current page indicator
Selecting and Deleting Records
1
Select rows
Use the checkbox on each row, or the header checkbox to select the whole page. A badge shows how many rows are selected.
2
Delete
Click Delete in the selection bar. The selected records are removed and the table refreshes.
Data Written by Agents
Collections linked to agents evolve outside the UI: agents insert and update records during conversations. Two things to keep in mind:- New columns can appear. Schemas are flexible: if an agent starts recording a new field, it shows up as a new column.
- System fields are protected. Record identifiers, creation timestamps, and ownership metadata are managed by the platform and cannot be modified, even by agents.
Best Practices
Sort before you clean
Sort before you clean
Sorting by a suspect column is the quickest way to find outliers: empty values group together, and malformed entries stand out at the top or bottom of the ordering.
Let the data answer for you
Let the data answer for you
Before scrolling through pages, try the Ask bar: “how many rows per status?” returns the breakdown instantly instead of counting by hand.
Delete in small batches
Delete in small batches
Select and delete rows page by page rather than removing large swaths at once; it is easier to verify what you removed.
Next Steps
Visualizations
Turn your records into charts
API Reference
Query and update records programmatically