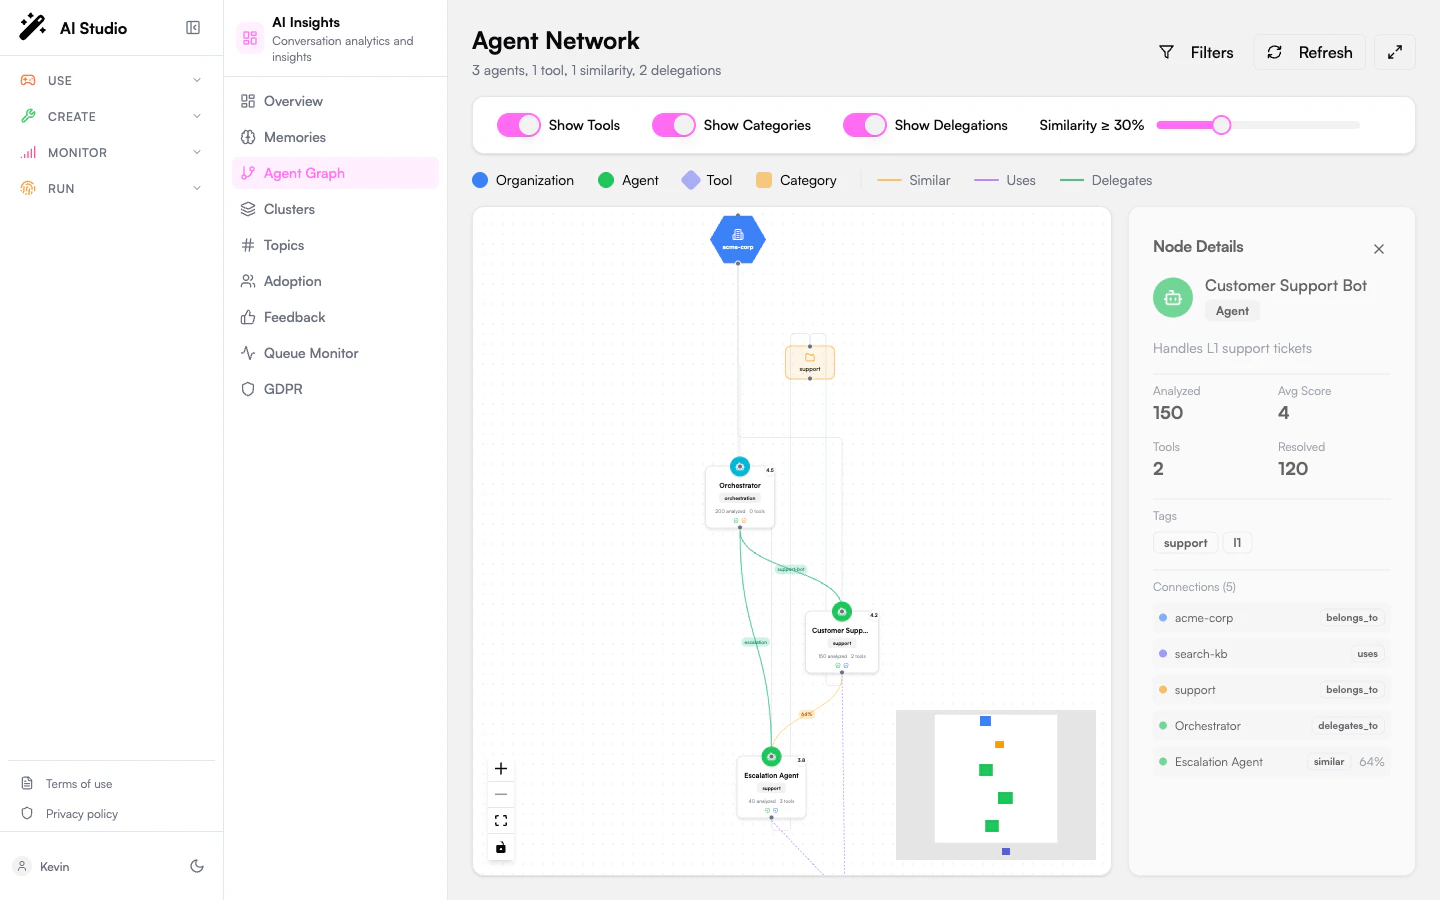
What the graph shows
Four node types and three edge types:
Layout is computed automatically with a layered ELK algorithm; you don’t need to position nodes manually.
Header controls
The top bar shows a one-line summary (“X agents, Y tools, Z similarities, W delegations”) and three buttons:- Filters: toggles the filter panel below.
- Refresh: re-fetches the graph data.
- Expand / Collapse: fullscreen mode. The minimap is hidden in fullscreen.
Filters
Open the filter panel with the Filters button. Three on/off toggles plus a slider:Node details panel
Click any node to load its details on the right:- The node’s name, type, and description.
- For agents: a metric grid with analyzed conversations, average score, tool count, resolved count.
- A list of tags.
- A Connections list with every node directly linked to this one. Click any item to jump focus to that node.
Canvas controls
Standard ReactFlow controls, on the canvas itself:- Drag any blank area to pan.
- Scroll to zoom.
- Drag a node to reposition it manually (the layout doesn’t auto-rerun).
- Click to select a node and load its details.
- Right-click a node for the context menu (where applicable).
Empty and error states
What to use this for
- Spot duplicate agents. Two agents on a thick Similar edge are doing almost the same thing; consider merging.
- Find orphans. Agents with very few connections often signal agents nobody is using.
- Audit tool sprawl. Tools with very high fan-in are critical infrastructure; a tool used by only one agent might be a candidate for deletion.
- Map delegation chains. Long delegation chains can introduce latency and ambiguity; flatten them where possible.
Where to go next
See clusters formally
The same similarity signal, grouped into named clusters.
Open one agent
Click any agent node to drill into its scoped view.