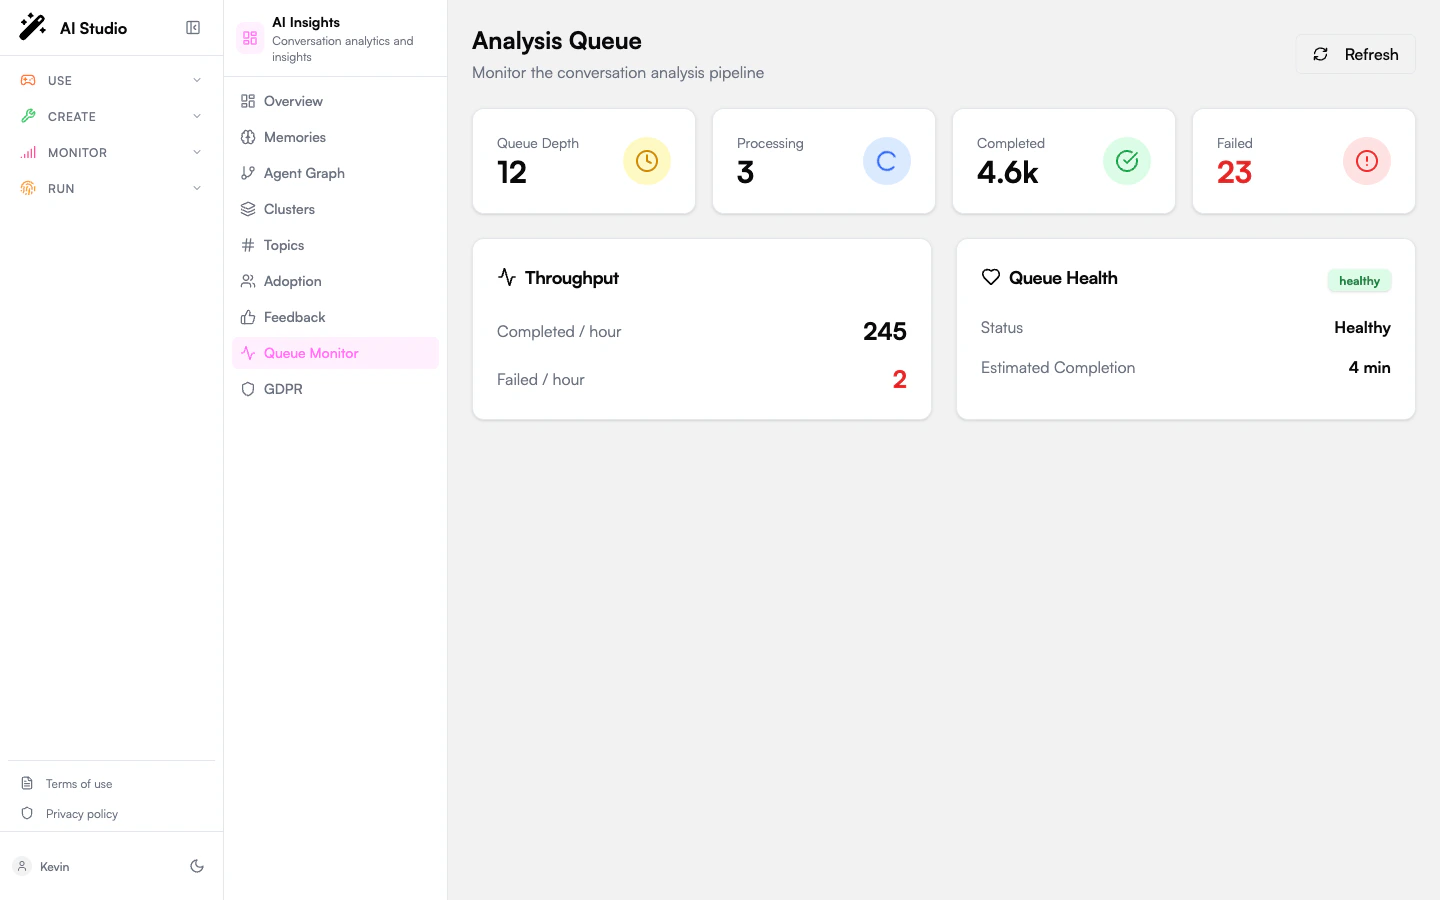
Documentation Index

Fetch the complete documentation index at: https://docs.prisme.ai/llms.txt

Use this file to discover all available pages before exploring further.

The Queue Monitor entry in the organization sidebar is the operational view of the analysis pipeline. Every conversation that gets analyzed flows through a queue with a worker pool, a daily budget, and rate limits. This page tells you whether the pipeline is keeping up.
Analysis Queue page with KPI cards, throughput card, and Queue Health card

KPI cards

Four cards summarizing queue state right now:
CardMeaning
Queue DepthConversations currently waiting to be analyzed (Pending). A growing depth means the workers can’t keep up.
ProcessingConversations currently being analyzed. Bounded by the worker pool size.
CompletedTotal conversations the pipeline finished successfully (lifetime counter for the period).
FailedTotal conversations that failed analysis. Shown in red so it stands out.

Throughput

A card showing rate metrics:
MetricMeaning
Completed Per HourSuccessful analyses per hour, averaged over the recent window.
Failed Per HourFailures per hour.
Use throughput to project when a backlog will clear. If Queue Depth is 5,000 and Completed Per Hour is 600, you have roughly 8 hours of work ahead — assuming no new conversations arrive in the meantime.

Queue Health

A status badge plus an estimated completion time:
StatusMeaning
healthyWorkers are keeping pace with incoming work.
busyDepth is non-trivial but throughput is sufficient.
backloggedDepth is growing faster than throughput. Consider rate-limiting new analyses or raising the workspace’s daily budget.
Estimated Completion shows how long until the current backlog clears at the current throughput. Displayed in minutes for short backlogs, hours for longer ones, or Unknown when throughput is zero. A Refresh button at the top of the page forces a re-fetch — the page doesn’t poll automatically.

Why analyses fail

Common failure modes that drive the Failed counter:
  • Conversation not found. The original conversation was deleted between queue and analyze, or the agent ID is invalid.
  • Model rate limit / timeout. The analysis LLM was unavailable. The pipeline retries up to 3 times before marking the conversation as failed.
  • Malformed criteria. A criterion question or option list that the LLM can’t reliably answer.
  • Quota exhausted. Daily analysis budget reached.
You can retry a single failed conversation from Conversations using the Re-analyze button. To retry many at once, batch-select the rows under the Failed filter and click Analyze Selected.

Where to go next

Trigger analysis on demand

Browse conversations and analyze them, batch-select to clear backlog.

Operator configuration

Tune the daily budget, rate limits, and worker capacity.