The Value of Activity Tracking
Activity tracking in Prisme.ai provides:Visibility
Complete transparency into how tools execute
Diagnostics
Powerful debugging for error resolution
Analytics
Performance metrics and usage patterns
Logging
Comprehensive audit trails of all operations
Monitoring
Real-time observation of system behavior
Optimization
Data-driven insights for performance improvements
Understanding the Event System
At the core of Prisme.ai’s Activity tracking is its event-driven architecture:Key Components
Events
Structured messages representing actions, status changes, or notificationsKey attributes:
- Event type
- Timestamp
- Source identifier
- Payload data
- Request context
Publishers
Components that emit events when actions occurExamples:
- Tool execution requests
- Automation processes
- User interactions
- System status changes
Subscribers
Components that listen for and process specific eventsExamples:
- Automation workflows
- Activity monitors
- Logging systems
- Analytics processors
Event Bus
The central message broker that routes eventsResponsibilities:
- Reliable message delivery
- Event persistence
- Publisher/subscriber coordination
- Load management
The Execution Lifecycle
Tool execution follows a well-defined lifecycle that generates events at each stage:Request Initiation
The process begins when an agent decides to use a tool.Events generated:
tool.request.initiatedtool.parameter.validation.started
- Tool name and parameters
- Request source (conversation ID, user ID)
- Timestamp and request ID
- Context information
Parameter Validation
The system validates that all required parameters are present and properly formatted.Events generated:
tool.parameter.validation.completedtool.parameter.validation.failed(if issues occur)
- Validation status
- Error details (if any)
- Parameter transformations
- Schema conformance
Execution
The actual tool code runs, performing its designated function.Events generated:
tool.execution.startedtool.execution.step.completed(for multi-step tools)tool.execution.completed
- Execution duration
- Resource utilization
- Intermediate state
- External system interactions
Result Processing
The system processes the tool’s output for agent consumption.Events generated:
tool.result.processing.startedtool.result.processing.completed
- Raw output data
- Processed results
- Formatting operations
- Output size and structure
Accessing Activity in Prisme.ai
You can monitor and analyze tool execution through several interfaces:- Activity View
- Event API
- Dashboard Visualizations
The primary interface for monitoring and debugging tool execution.Key features: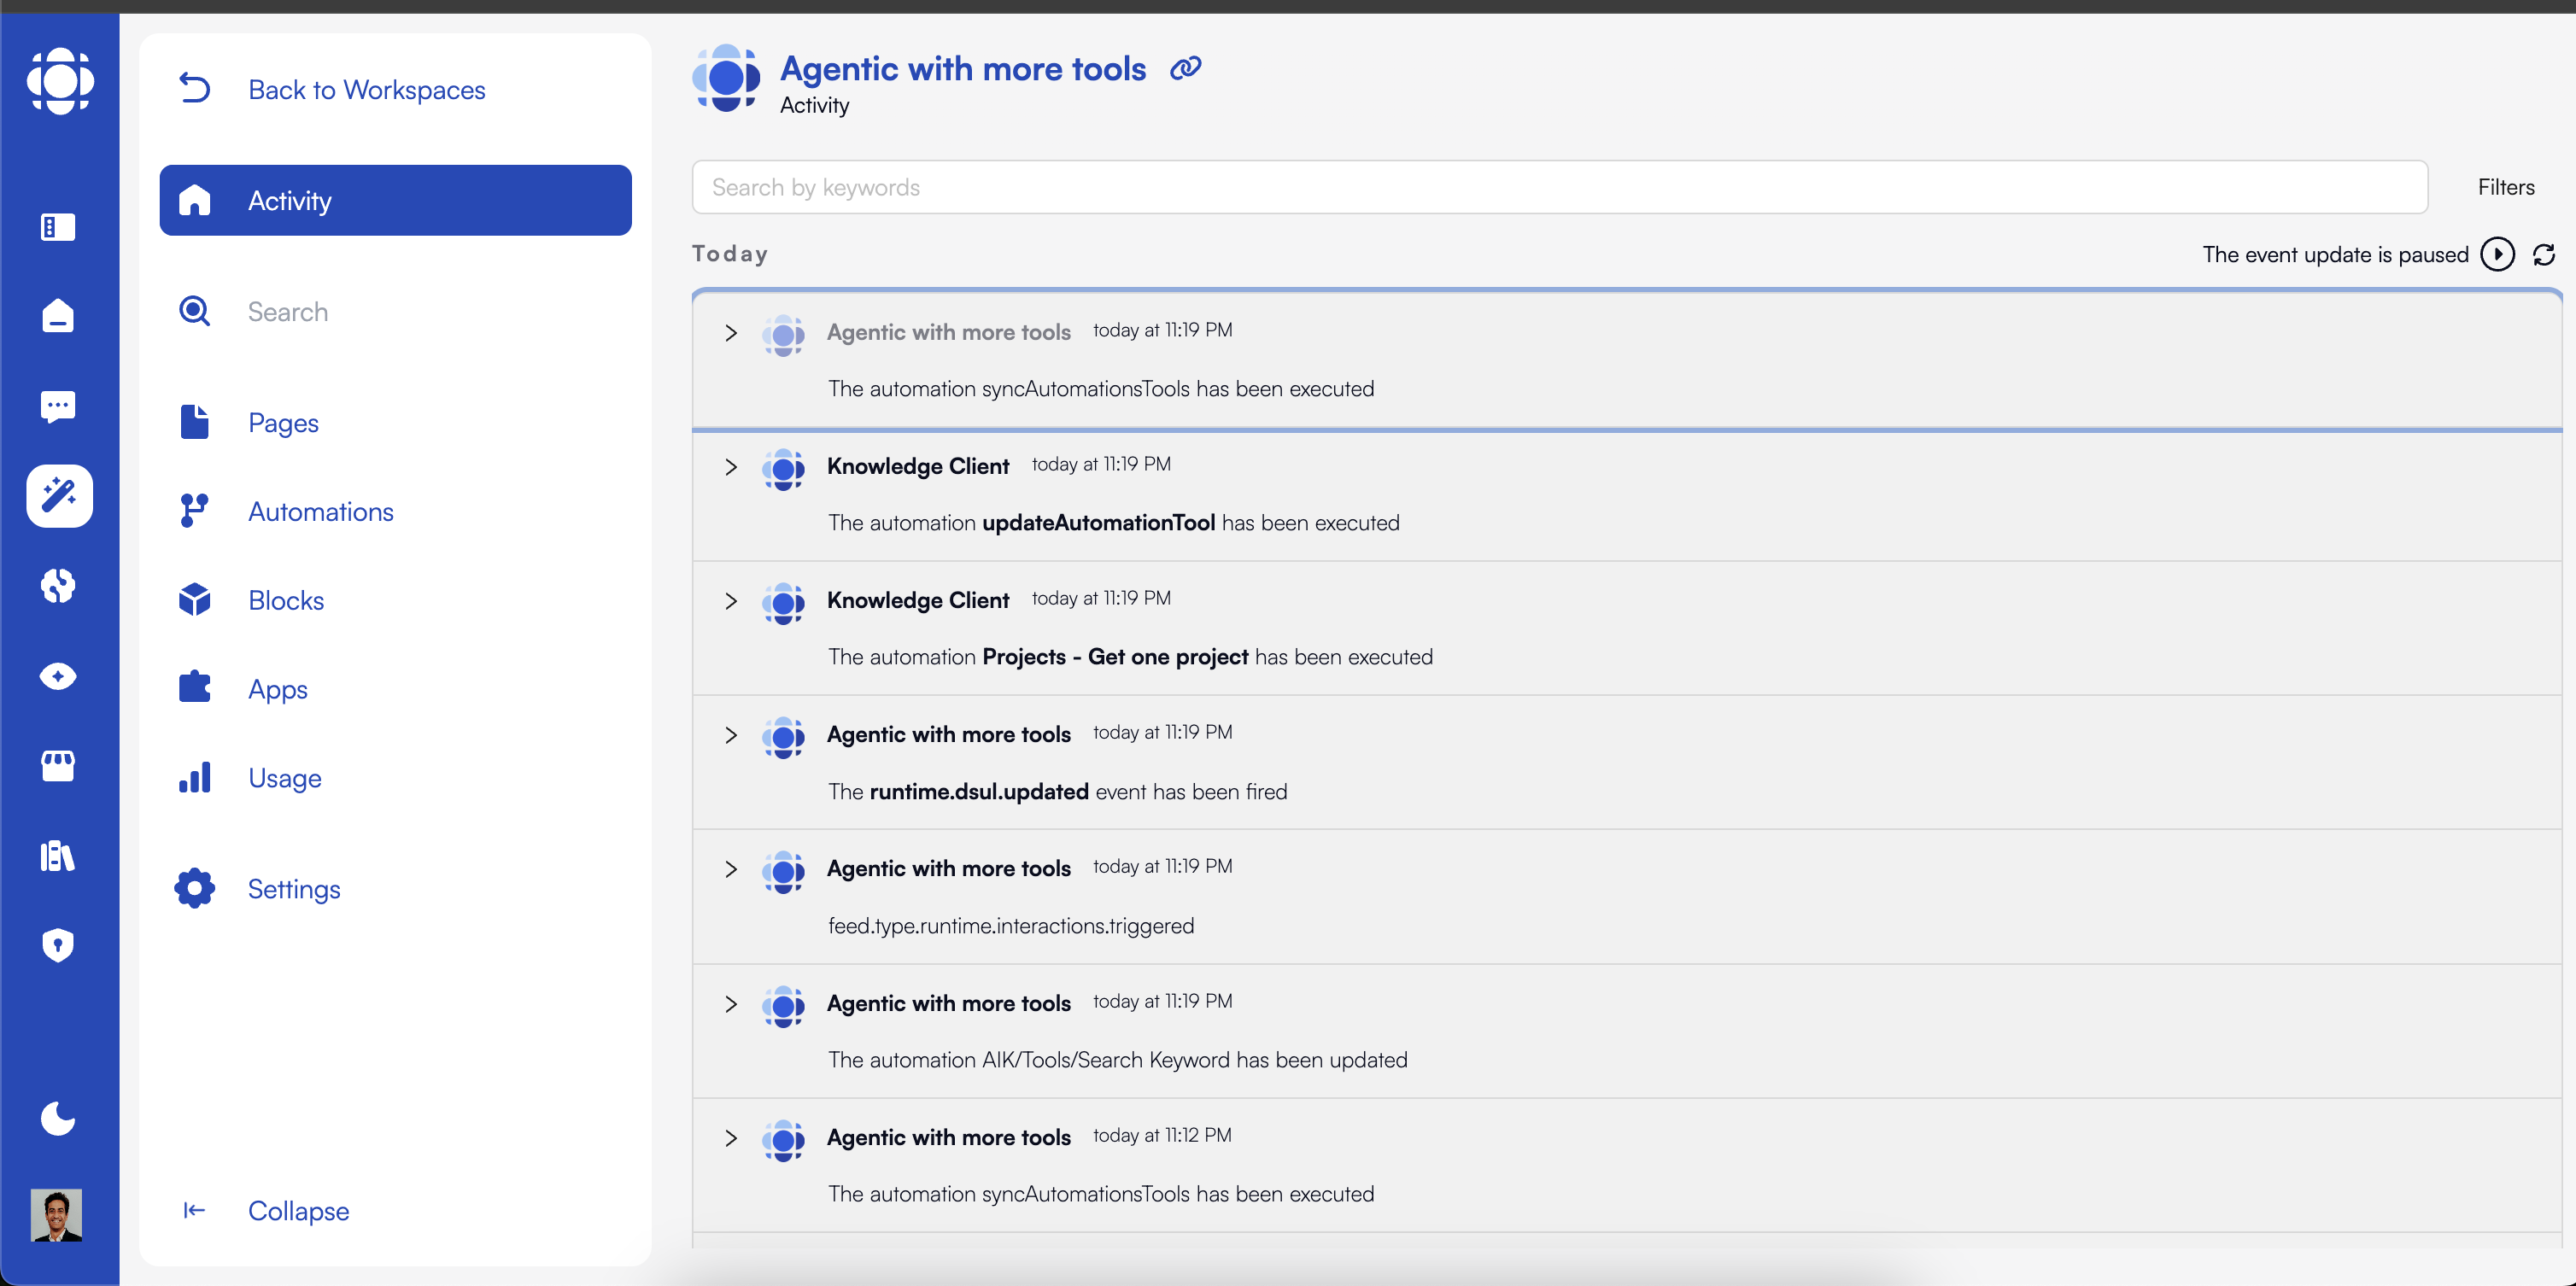
- Chronological event listing
- Filtering by event type, status, or date range
- Detailed event inspection
- Real-time monitoring
- Search capabilities
- Navigate to the “Activity” tab in your AI Builder workspace
- Use filtering to focus on relevant events
- Click on events to see detailed information
- Toggle real-time updates for live monitoring
Common Event Types
Prisme.ai’s event system uses a hierarchical naming convention for clarity and filtering:Tool Request Events
Tool Request Events
Events related to the initial tool request and setup.Key event types:
tool.request.initiated: Initial request for tool executiontool.request.validated: Request passed preliminary validationtool.request.rejected: Request failed preliminary checks
Execution Events
Execution Events
Events related to the actual tool execution process.Key event types:
tool.execution.started: Tool execution has beguntool.execution.step.completed: A step in multi-step execution completedtool.execution.completed: Tool execution finished successfullytool.execution.failed: Tool execution encountered an error
Result Events
Result Events
Events related to the processing and delivery of tool results.Key event types:
tool.result.generated: Raw results from tool executiontool.result.processed: Results after formatting and preparationtool.result.delivered: Final delivery to the requester
Error Events
Error Events
Events related to errors during the tool execution lifecycle.Key event types:
tool.error.validation: Error during parameter validationtool.error.execution: Error during tool executiontool.error.timeout: Execution exceeded allocated timetool.error.resource: Resource limit exceeded
Debugging with Activity
Activity tracking provides powerful capabilities for diagnosing and resolving issues:Identify the Issue
Use filtering to locate relevant events.Effective filtering strategies:
- Search for specific request IDs
- Filter by error event types
- Focus on a specific time range
- Filter by tool name or source
- Search for specific error codes
Trace Execution Flow
Follow the sequence of events to understand the execution path.Key analysis techniques:
- Map the complete event sequence
- Identify missing or unexpected events
- Analyze timing between events
- Examine state changes across events
- Look for execution branches
Examine Event Details
Inspect detailed event data for diagnostic information.Focus areas:
- Parameter values and transformations
- Error details and context
- Performance metrics
- External system interactions
- Resource utilization
Compare with Successful Executions
Analyze differences between failed and successful runs.Comparison strategies:
- Identify parameter differences
- Compare timing patterns
- Analyze resource usage
- Examine external factors
- Look for environmental changes
Monitoring Performance with Activity
Activity data is invaluable for performance optimization:Latency Analysis
Latency Analysis
Identify and address performance bottlenecks.Key metrics to monitor:
- End-to-end latency: Total time from request to response
- Execution time: Time spent in actual tool execution
- External call latency: Time spent waiting for external services
- Processing overhead: Time spent in non-execution activities
Error Rate Tracking
Error Rate Tracking
Monitor and minimize tool failures.Key metrics to track:
- Overall error rate: Percentage of tool executions that fail
- Error breakdown by type: Distribution of different error categories
- Error trends: Changes in error rates over time
- Correlation analysis: Factors associated with higher error rates
Usage Pattern Analysis
Usage Pattern Analysis
Understand how tools are being used.Key metrics to analyze:
- Usage frequency: How often each tool is called
- Parameter distributions: Common values and patterns
- Usage contexts: When and why tools are invoked
- User segmentation: Differences in tool usage across users
Optimizing Tool Execution
Use Activity data to drive execution optimizations:Parameter Optimization
Refine parameter handling based on usage patternsStrategies:
- Add intelligent defaults for common values
- Implement parameter validation improvements
- Optimize parameter extraction from user inputs
- Add preprocessing for frequently used parameter formats
Execution Efficiency
Improve tool execution performanceStrategies:
- Identify and optimize slow execution steps
- Implement caching for frequent operations
- Reduce external API latency
- Optimize resource utilization
Error Reduction
Minimize tool execution failuresStrategies:
- Add robust error handling for common failures
- Implement automatic retries for transient issues
- Improve validation to catch problems early
- Create fallback mechanisms for critical functions
Result Processing
Enhance result formatting and deliveryStrategies:
- Optimize result formatting for LLM consumption
- Reduce result size for better context utilization
- Implement progressive result delivery for long operations
- Add enrichment for more valuable outputs
Custom Event Emission
You can emit custom events to enhance visibility into your tools:Custom Event Types
Custom Event Types
Define your own event types for specialized monitoring.Naming conventions:Examples:
custom.finance-assistant.calculation.startedcustom.support-agent.ticket.createdcustom.inventory-tool.stock.checked
Emitting Custom Events
Emitting Custom Events
Add custom event emission to your tools.Example implementation:This approach:
- Provides detailed visibility into tool execution stages
- Captures business-specific metrics
- Enables more nuanced performance analysis
- Creates richer debugging context
Event Payload Best Practices
Event Payload Best Practices
Design effective event payloads for maximum utility.Recommendations:
- Include identifiers: Always add request IDs, user IDs, and other correlation identifiers
- Add timestamps: Include timing information for performance analysis
- Provide context: Add relevant business context to make events meaningful
- Size appropriately: Include useful data without making events too large
- Structure consistently: Use consistent naming and structure across related events
Real-Time Monitoring
For critical tools, implement real-time monitoring using Activity:Set Up Real-Time Dashboards
Create specialized dashboards for key metrics.Include dashboards for:
- Error rates and types
- Execution latency
- Usage volume
- Resource utilization
- Business-specific metrics
Configure Alerts
Define thresholds and conditions for notifications.Alert types to consider:
- Error rate spikes
- Latency threshold violations
- Abnormal usage patterns
- Resource exhaustion warnings
- Custom business metric anomalies
Activity for Compliance and Audit
Beyond operational uses, Activity provides essential compliance capabilities:Audit Trails
Maintain comprehensive records of all tool interactionsKey aspects:
- Complete chronological record of events
- User and system actions
- Parameter and result tracking
- Timing information
- Access evidence
Compliance Reporting
Generate reports for regulatory requirementsCapabilities:
- Data access audit reports
- Processing evidence
- Security monitoring
- Policy enforcement verification
- Chain of custody documentation
Forensic Analysis
Detailed investigation of specific incidentsUse cases:
- Security incident investigation
- Error root cause analysis
- User behavior auditing
- System interaction reconstruction
- Performance issue diagnostics
Records Retention
Maintain activity data according to policiesConsiderations:
- Retention period configuration
- Data archiving strategies
- Privacy compliance
- Data minimization
- Access controls
Best Practices for Activity Utilization
Develop an Event Strategy
Develop an Event Strategy
Plan your event ecosystem for maximum value.Recommendations:
- Define an event taxonomy: Create a consistent naming and categorization system
- Identify key lifecycle events: Ensure all important state transitions emit events
- Balance detail and volume: Emit enough events for visibility without overwhelming storage
- Consider event consumers: Design with reporting, monitoring, and analysis needs in mind
- Document event types: Maintain clear documentation of all events and their meanings
Implement Effective Filtering
Implement Effective Filtering
Create filtering strategies for efficient data access.Recommendations:
- Use consistent metadata: Add standard fields like request IDs to enable correlation
- Include categorization data: Add tags, types, and categories for efficient filtering
- Consider time-based access: Optimize for common time-range queries
- Balance filter granularity: Too granular filters can be as problematic as too broad ones
- Test filter performance: Ensure filtering is efficient at production scale
Design for Scalability
Design for Scalability
Ensure your activity management scales with usage.Recommendations:
- Implement data lifecycle management: Archive older events to control storage growth
- Consider sampling for high-volume events: For very frequent events, consider sampling
- Optimize query patterns: Design queries to use available indexes
- Leverage aggregation: Use pre-aggregated metrics for frequent analyses
- Plan for growth: Design with future scale in mind
Activity in AI Knowledge
For AI Knowledge users, Activity information is accessible through built-in interfaces:Access the Activity Log
Find the Activity section in AI Knowledge.Key features:
- Chronological event listing
- Filtering by event type and date
- Search capabilities
- Drill-down for details
Monitor Tool Usage
Track how agents are using tools.Available information:
- Tool usage frequency
- Success and error rates
- Performance metrics
- Parameter patterns
Analyze Conversation Flows
Examine how tools integrate into conversations.Analysis capabilities:
- Tool usage in conversation context
- User reactions to tool results
- Multi-turn tool interactions
- Conversation paths and patterns
Next Steps
Ready to implement effective execution monitoring and activity tracking? Continue with these resources:Error Handling
Learn how to implement robust error management
AI Builder Event System
Explore the event system in greater depth