> ## Documentation Index
> Fetch the complete documentation index at: https://docs.prisme.ai/llms.txt
> Use this file to discover all available pages before exploring further.
# Consumption
> The billing-angle view of your organization: interactions, the workspaces and apps inventory, LLM requests, and per-user consumption.
Consumption is the billing-angle view of your whole organization. Where the [Organization dashboard](/products/ai-insights/dashboard) reads the fleet through adoption and quality, this page reads it through what you actually consume: billable interactions, the workspaces and apps that generate them, LLM requests split by type, and a per-user breakdown you can charge back.
 ## Interactions, the Prisme billing unit
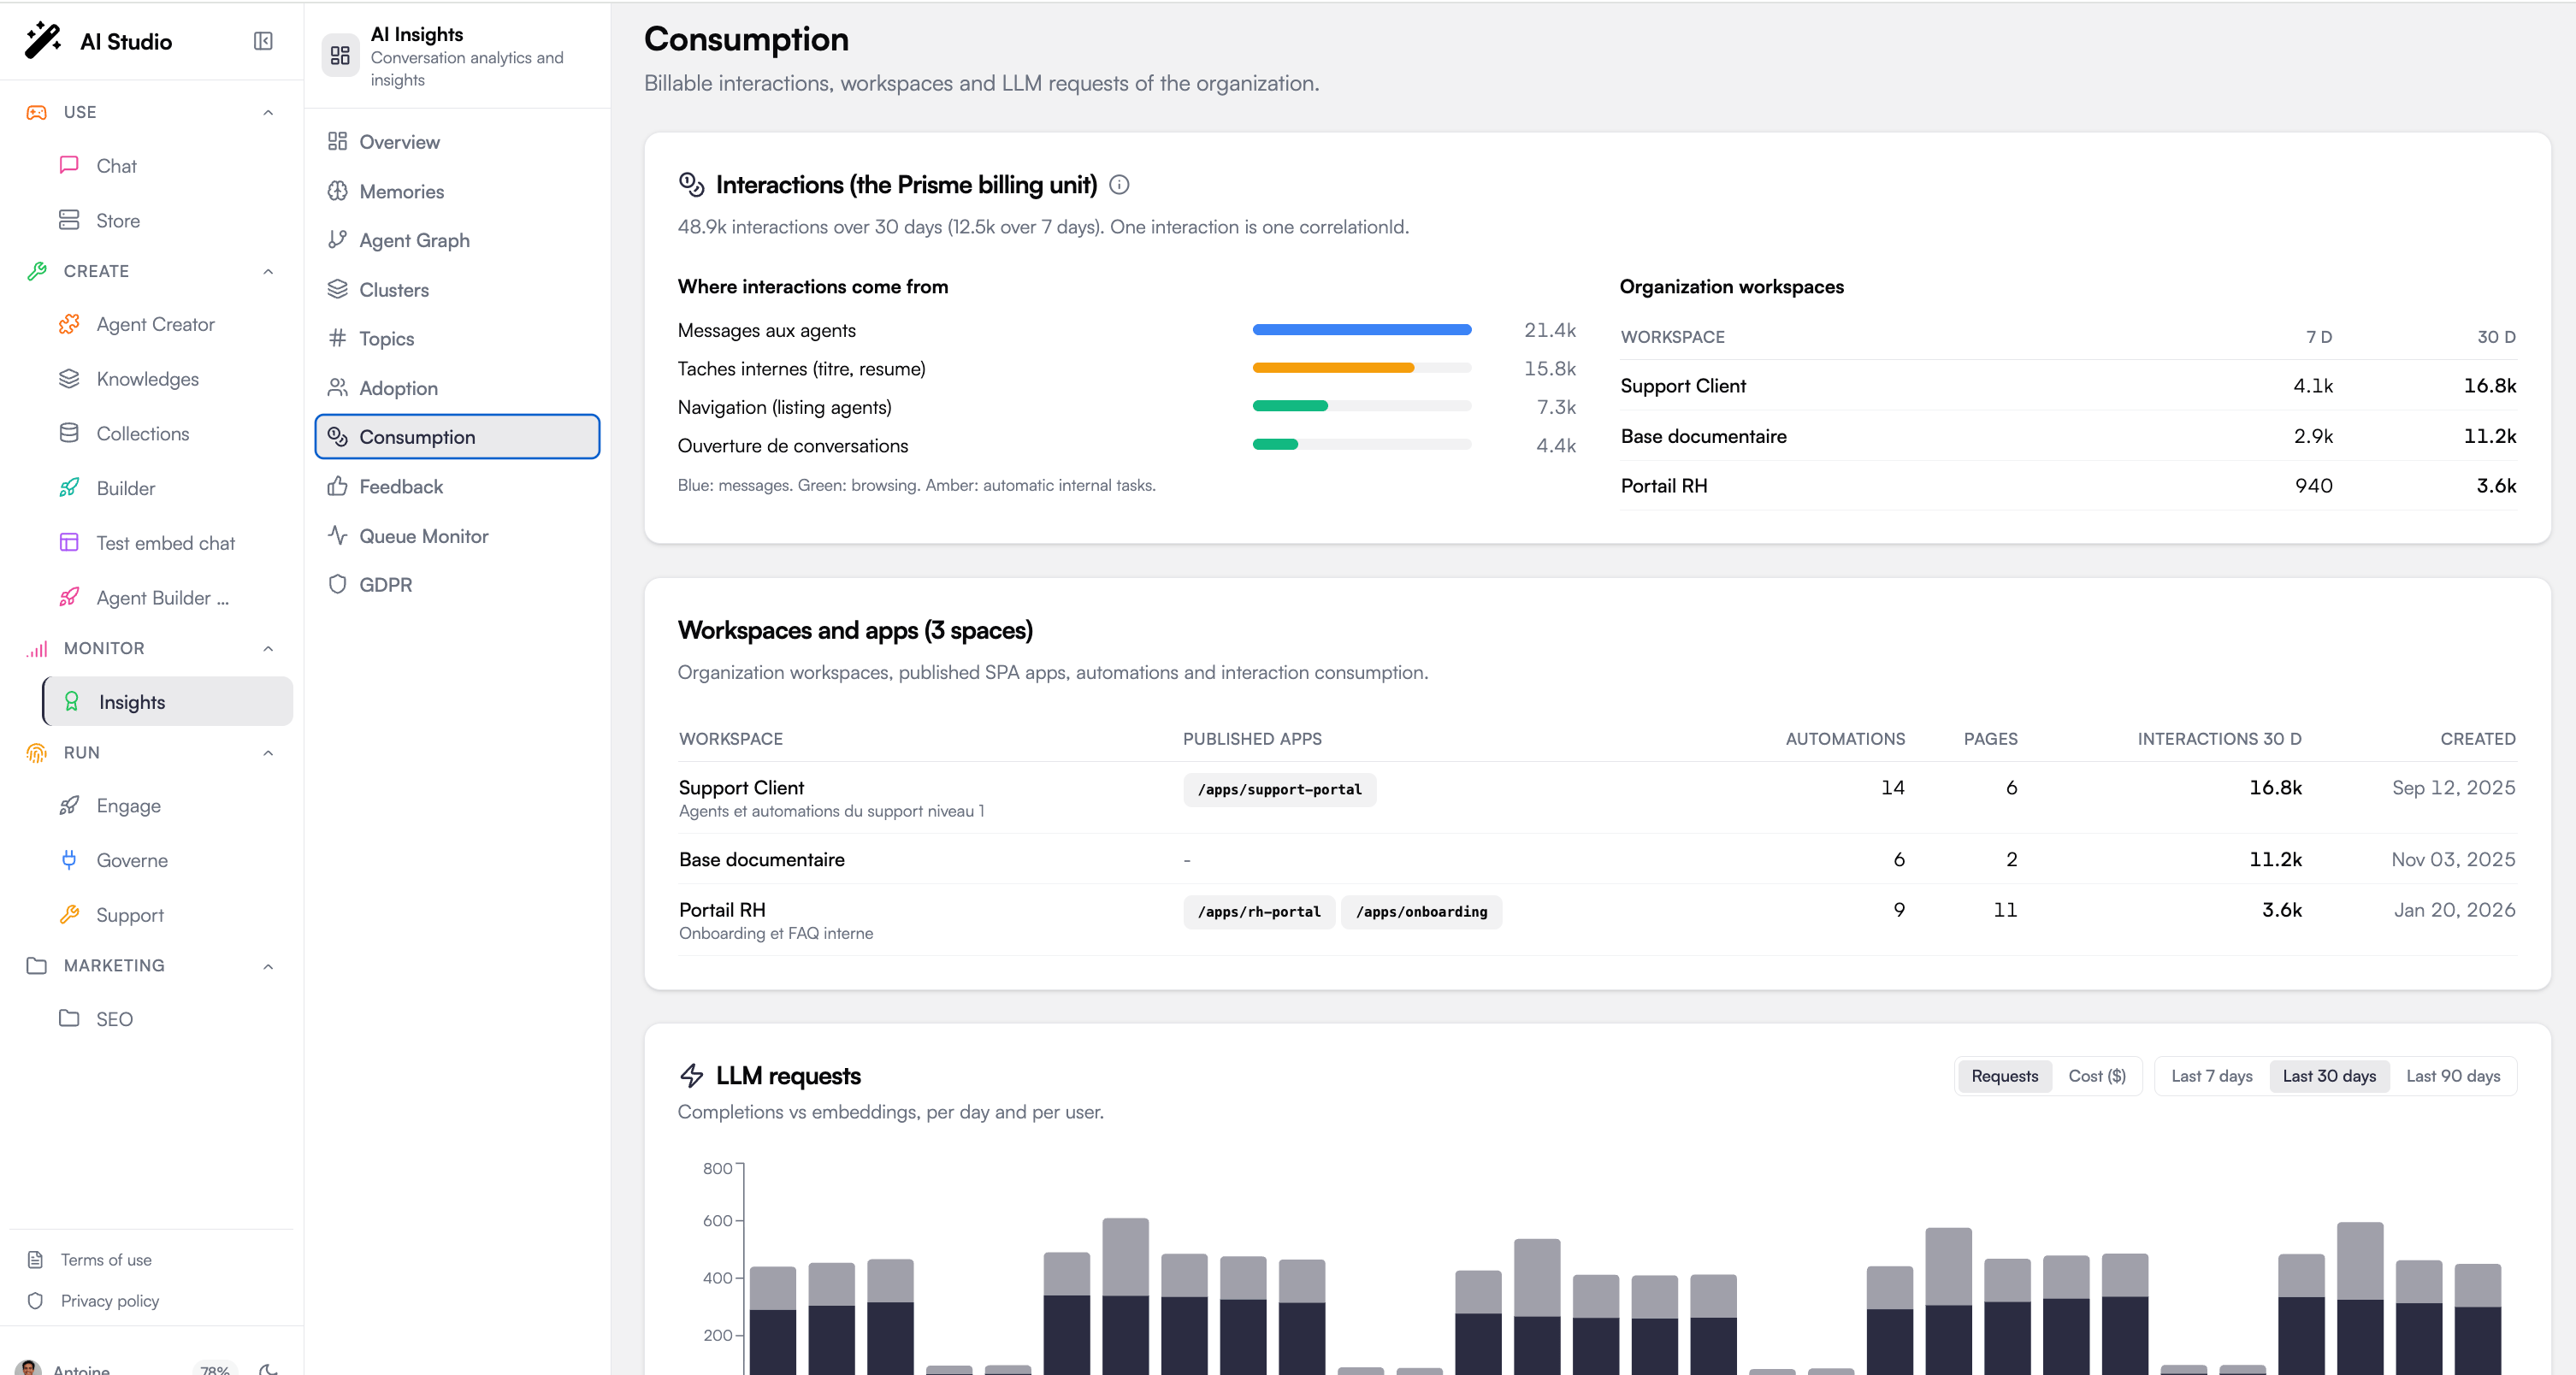
The headline block is **Interactions (the Prisme billing unit)**. One interaction is one `correlationId` created on the Prisme side. It is the unit your consumption is counted in.
The subtitle rolls the totals up as *N interactions over 30 days (M over 7 days)*, and an info tooltip explains what feeds the count.
Interactions are not the same as messages. For a single member, the count adds up: each message sent to an agent, the automatic internal tasks each message triggers (title generation, summary, finalization), and interface browsing (agent listing, opening conversations). This is why the interaction figure is typically 6 to 7 times higher than the raw message count.
### Where interactions come from
The left column, **Where interactions come from**, ranks the entry points that generate interactions, each with a horizontal bar and a count. The bar color encodes the kind of interaction:
| Color | Kind |
| --------- | -------------------------------------------------------------------------------------------------------------------- |
| **Blue** | Messages: users sending a message to an agent. |
| **Green** | Browsing: interface navigation such as listing agents or opening conversations. |
| **Amber** | Automatic internal tasks: work triggered by the platform itself, for example title, summary, and finalization steps. |
### Organization workspaces
The right column lists your organization's workspaces with their interaction counts over the last **7 days** and **30 days**, so you can see which workspaces drive the most consumption.
## Workspaces and apps inventory
## Interactions, the Prisme billing unit
The headline block is **Interactions (the Prisme billing unit)**. One interaction is one `correlationId` created on the Prisme side. It is the unit your consumption is counted in.
The subtitle rolls the totals up as *N interactions over 30 days (M over 7 days)*, and an info tooltip explains what feeds the count.
Interactions are not the same as messages. For a single member, the count adds up: each message sent to an agent, the automatic internal tasks each message triggers (title generation, summary, finalization), and interface browsing (agent listing, opening conversations). This is why the interaction figure is typically 6 to 7 times higher than the raw message count.
### Where interactions come from
The left column, **Where interactions come from**, ranks the entry points that generate interactions, each with a horizontal bar and a count. The bar color encodes the kind of interaction:
| Color | Kind |
| --------- | -------------------------------------------------------------------------------------------------------------------- |
| **Blue** | Messages: users sending a message to an agent. |
| **Green** | Browsing: interface navigation such as listing agents or opening conversations. |
| **Amber** | Automatic internal tasks: work triggered by the platform itself, for example title, summary, and finalization steps. |
### Organization workspaces
The right column lists your organization's workspaces with their interaction counts over the last **7 days** and **30 days**, so you can see which workspaces drive the most consumption.
## Workspaces and apps inventory
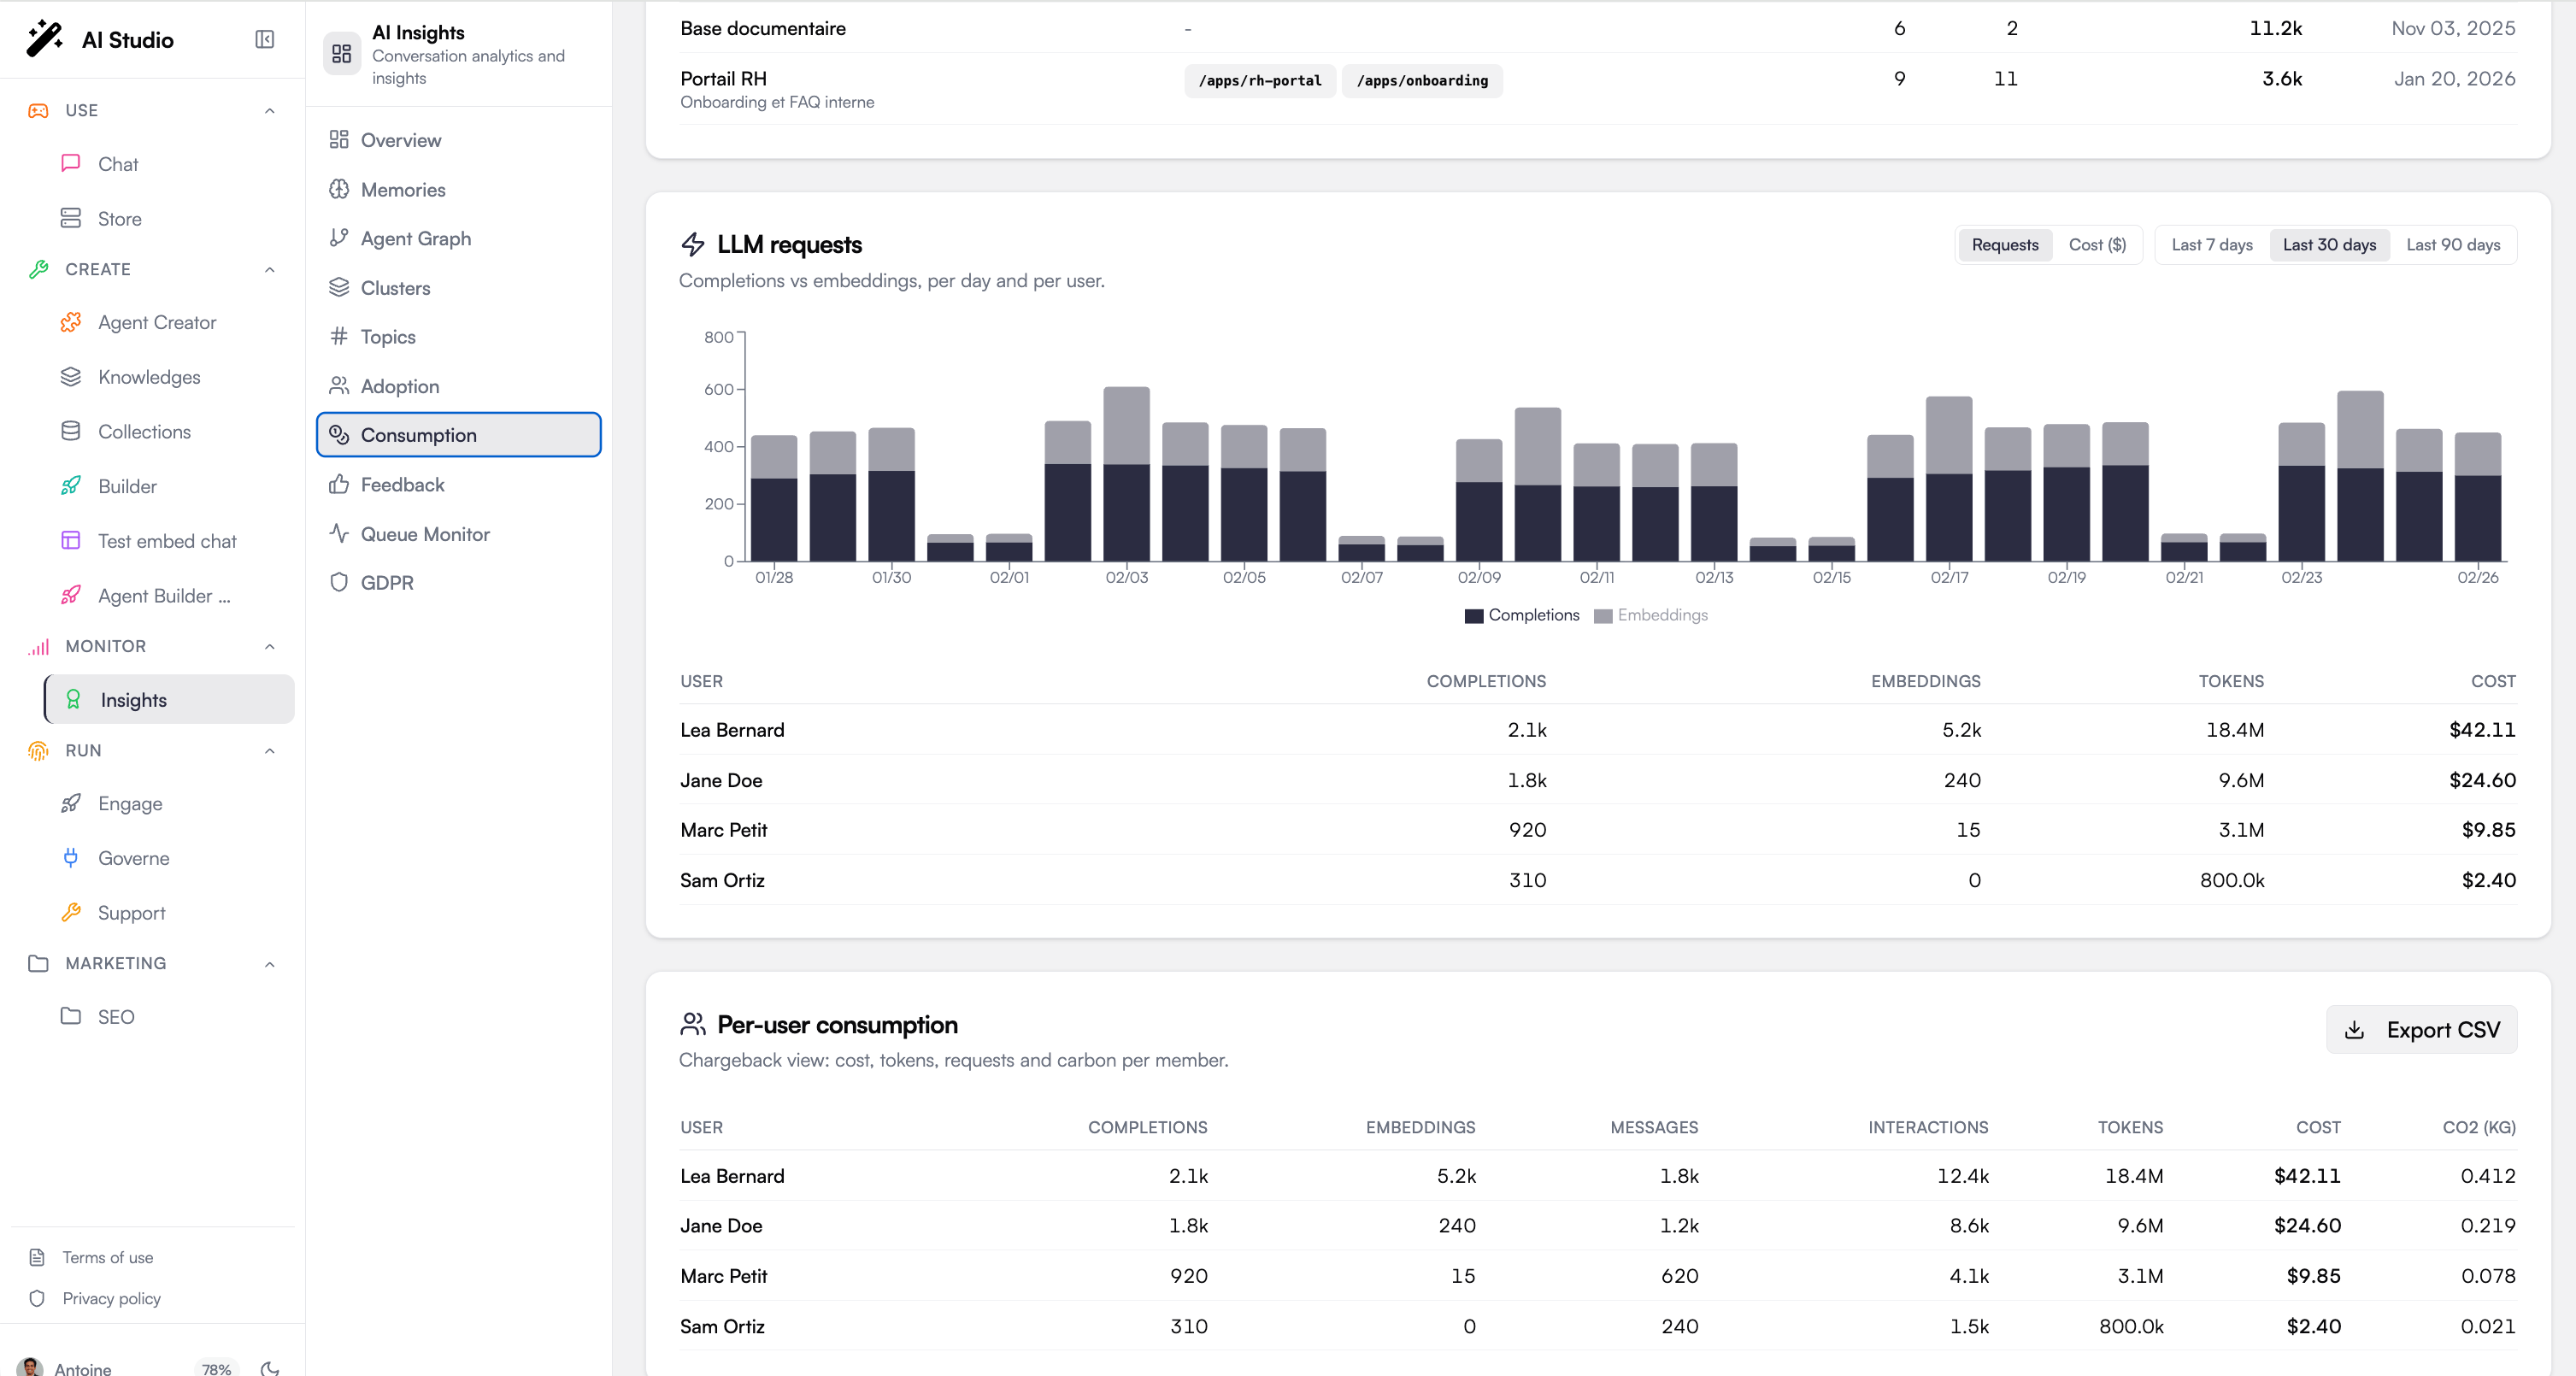 The **Workspaces and apps** table is a full inventory of the organization's spaces. Each row is one workspace, and the header shows the total number of spaces. Per workspace you get:
| Column | What it shows |
| --------------------- | ------------------------------------------------------------------------ |
| **Workspace** | The workspace name and, when set, its description. |
| **Published apps** | The published SPA apps, shown as `/apps/` badges. |
| **Automations** | Count of automations in the workspace. |
| **Pages** | Count of pages. |
| **Interactions 30 d** | Billable interactions attributed to the workspace over the last 30 days. |
| **Created** | The workspace creation date. |
## LLM requests
The **LLM requests** card charts model activity per day, stacked into two series:
* **Completions**: generation requests.
* **Embeddings**: vectorization requests.
A period selector scopes the chart, and a toggle switches the unit between:
* **Requests**: raw request counts.
* **Cost (\$)**: the same series expressed in dollars.
The cost toggle only appears when cost data is available for the period. Without it, the card shows request counts only.
Below the chart, a **per-user table** breaks the same window down by member, with completions, embeddings, tokens, and cost per user.
## Per-user consumption
The **Per-user consumption** card is the chargeback view: one row per member, so you can attribute spend across your organization. Columns cover completions, embeddings, messages, interactions, tokens, cost, and estimated CO2 (kg).
Use the **Export CSV** action in the card header to download the full breakdown, for example to feed an internal cost-allocation or reporting workflow.
## Aggregation freshness
Consumption analytics are computed from a backend aggregation. Blocks render only when their data exists, so a section stays hidden until the corresponding metrics are available for your environment.
## Where to go next
Fleet-level KPIs for adoption, cost, and quality.
User segments and recommendations to grow each one.
The per-agent users table: who used a given agent and how much.
The **Workspaces and apps** table is a full inventory of the organization's spaces. Each row is one workspace, and the header shows the total number of spaces. Per workspace you get:
| Column | What it shows |
| --------------------- | ------------------------------------------------------------------------ |
| **Workspace** | The workspace name and, when set, its description. |
| **Published apps** | The published SPA apps, shown as `/apps/` badges. |
| **Automations** | Count of automations in the workspace. |
| **Pages** | Count of pages. |
| **Interactions 30 d** | Billable interactions attributed to the workspace over the last 30 days. |
| **Created** | The workspace creation date. |
## LLM requests
The **LLM requests** card charts model activity per day, stacked into two series:
* **Completions**: generation requests.
* **Embeddings**: vectorization requests.
A period selector scopes the chart, and a toggle switches the unit between:
* **Requests**: raw request counts.
* **Cost (\$)**: the same series expressed in dollars.
The cost toggle only appears when cost data is available for the period. Without it, the card shows request counts only.
Below the chart, a **per-user table** breaks the same window down by member, with completions, embeddings, tokens, and cost per user.
## Per-user consumption
The **Per-user consumption** card is the chargeback view: one row per member, so you can attribute spend across your organization. Columns cover completions, embeddings, messages, interactions, tokens, cost, and estimated CO2 (kg).
Use the **Export CSV** action in the card header to download the full breakdown, for example to feed an internal cost-allocation or reporting workflow.
## Aggregation freshness
Consumption analytics are computed from a backend aggregation. Blocks render only when their data exists, so a section stays hidden until the corresponding metrics are available for your environment.
## Where to go next
Fleet-level KPIs for adoption, cost, and quality.
User segments and recommendations to grow each one.
The per-agent users table: who used a given agent and how much.