> ## Documentation Index
> Fetch the complete documentation index at: https://docs.prisme.ai/llms.txt
> Use this file to discover all available pages before exploring further.
# Observability
> Aggregated per-workspace health, metrics, errors, usage, and dependencies with deep links back to Activity
Observability is the aggregated view of a single workspace, reachable at `/builder/:id/observability`. Where [Activity](/products/ai-builder/activity) shows the raw event feed, Observability rolls those events up into dashboards for health, latency, errors, usage, and dependencies.
This is the same per-workspace observability that previously lived in Governance. It has been moved into Builder and scoped to the one workspace you are editing, so you no longer leave the workspace to see how it is behaving. Throughout the dashboards, charts and ranking rows deep-link back to the [Activity](/products/ai-builder/activity) feed, pre-filtered on the relevant automation or correlation IDs, so you can jump from an aggregate straight to the underlying events.
 ## Period selector
A period selector in the header scopes every tab to one of four presets: **1h**, **24h**, **7d**, or **30d** (the default is 7d). Longer ranges are intentionally not offered here; the backend enforces its own server-side cap to keep long-range aggregation cheap.
## Tabs
Observability is organized into five tabs.
### Overview
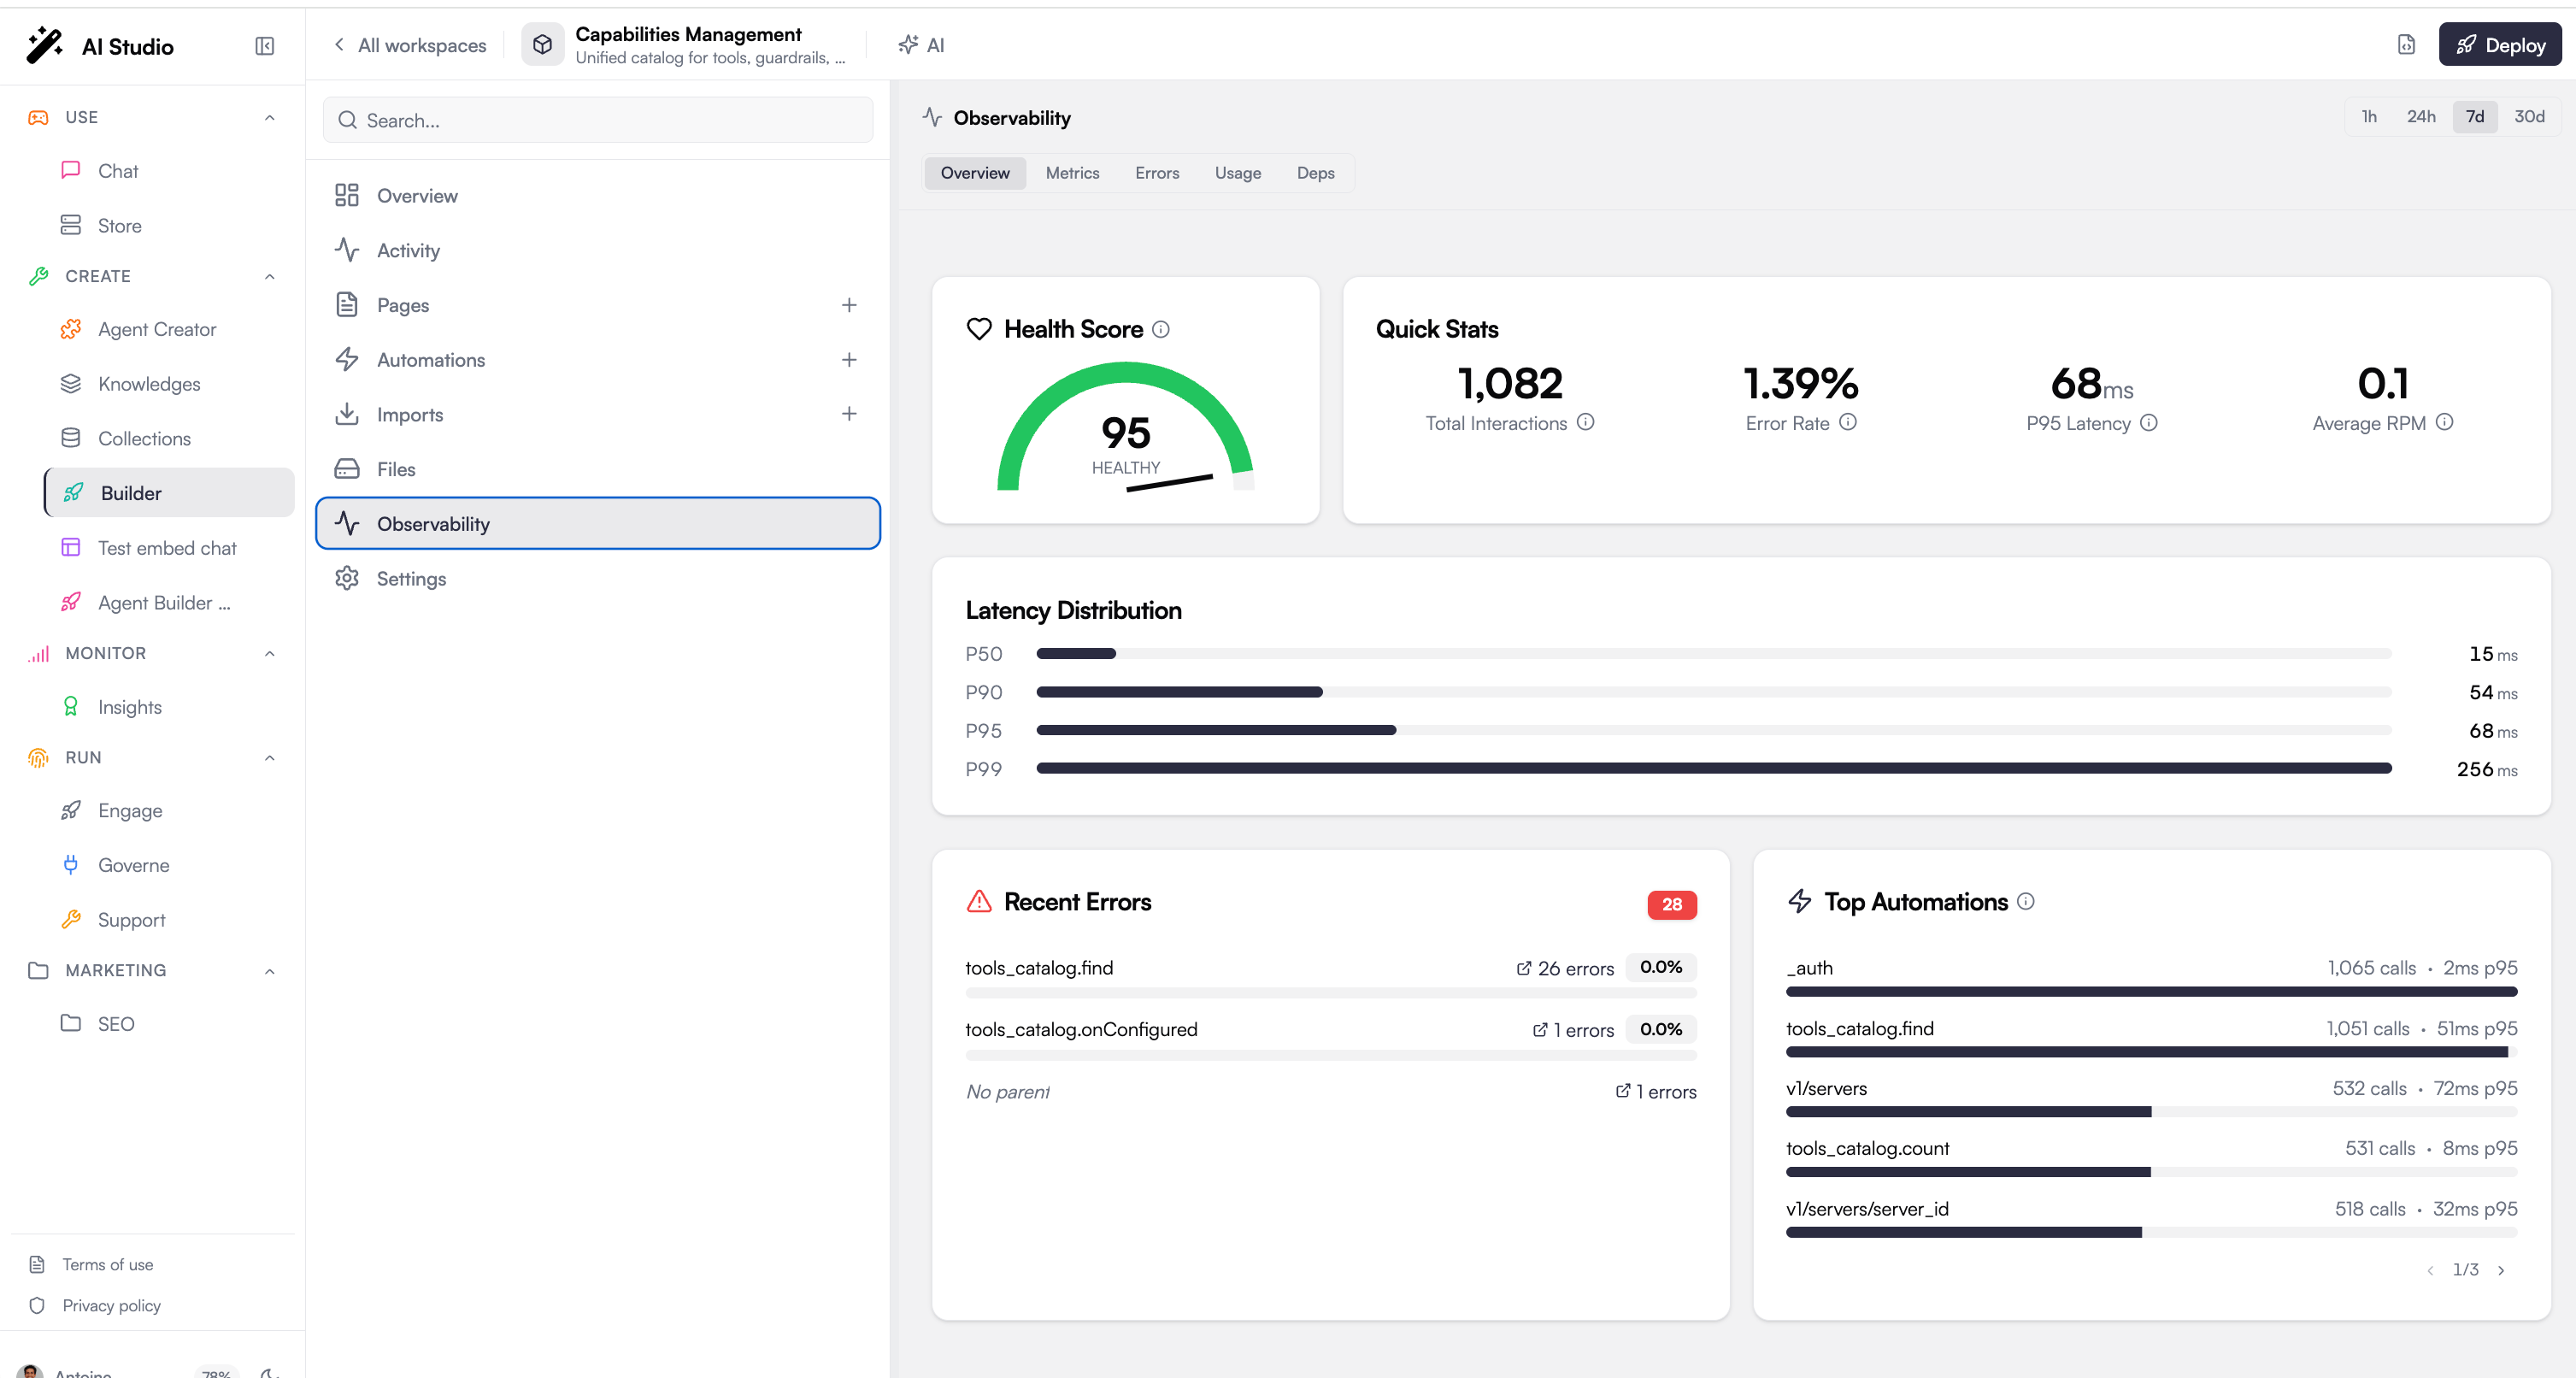
A summary of the workspace's health for the selected period.
* A **health gauge** with a score and status.
* Quick stats: total interactions, error rate, p95 latency, and average requests per minute.
* A **latency distribution** chart.
* **Recent errors** (errors grouped by automation) and **top automations**.
### Metrics
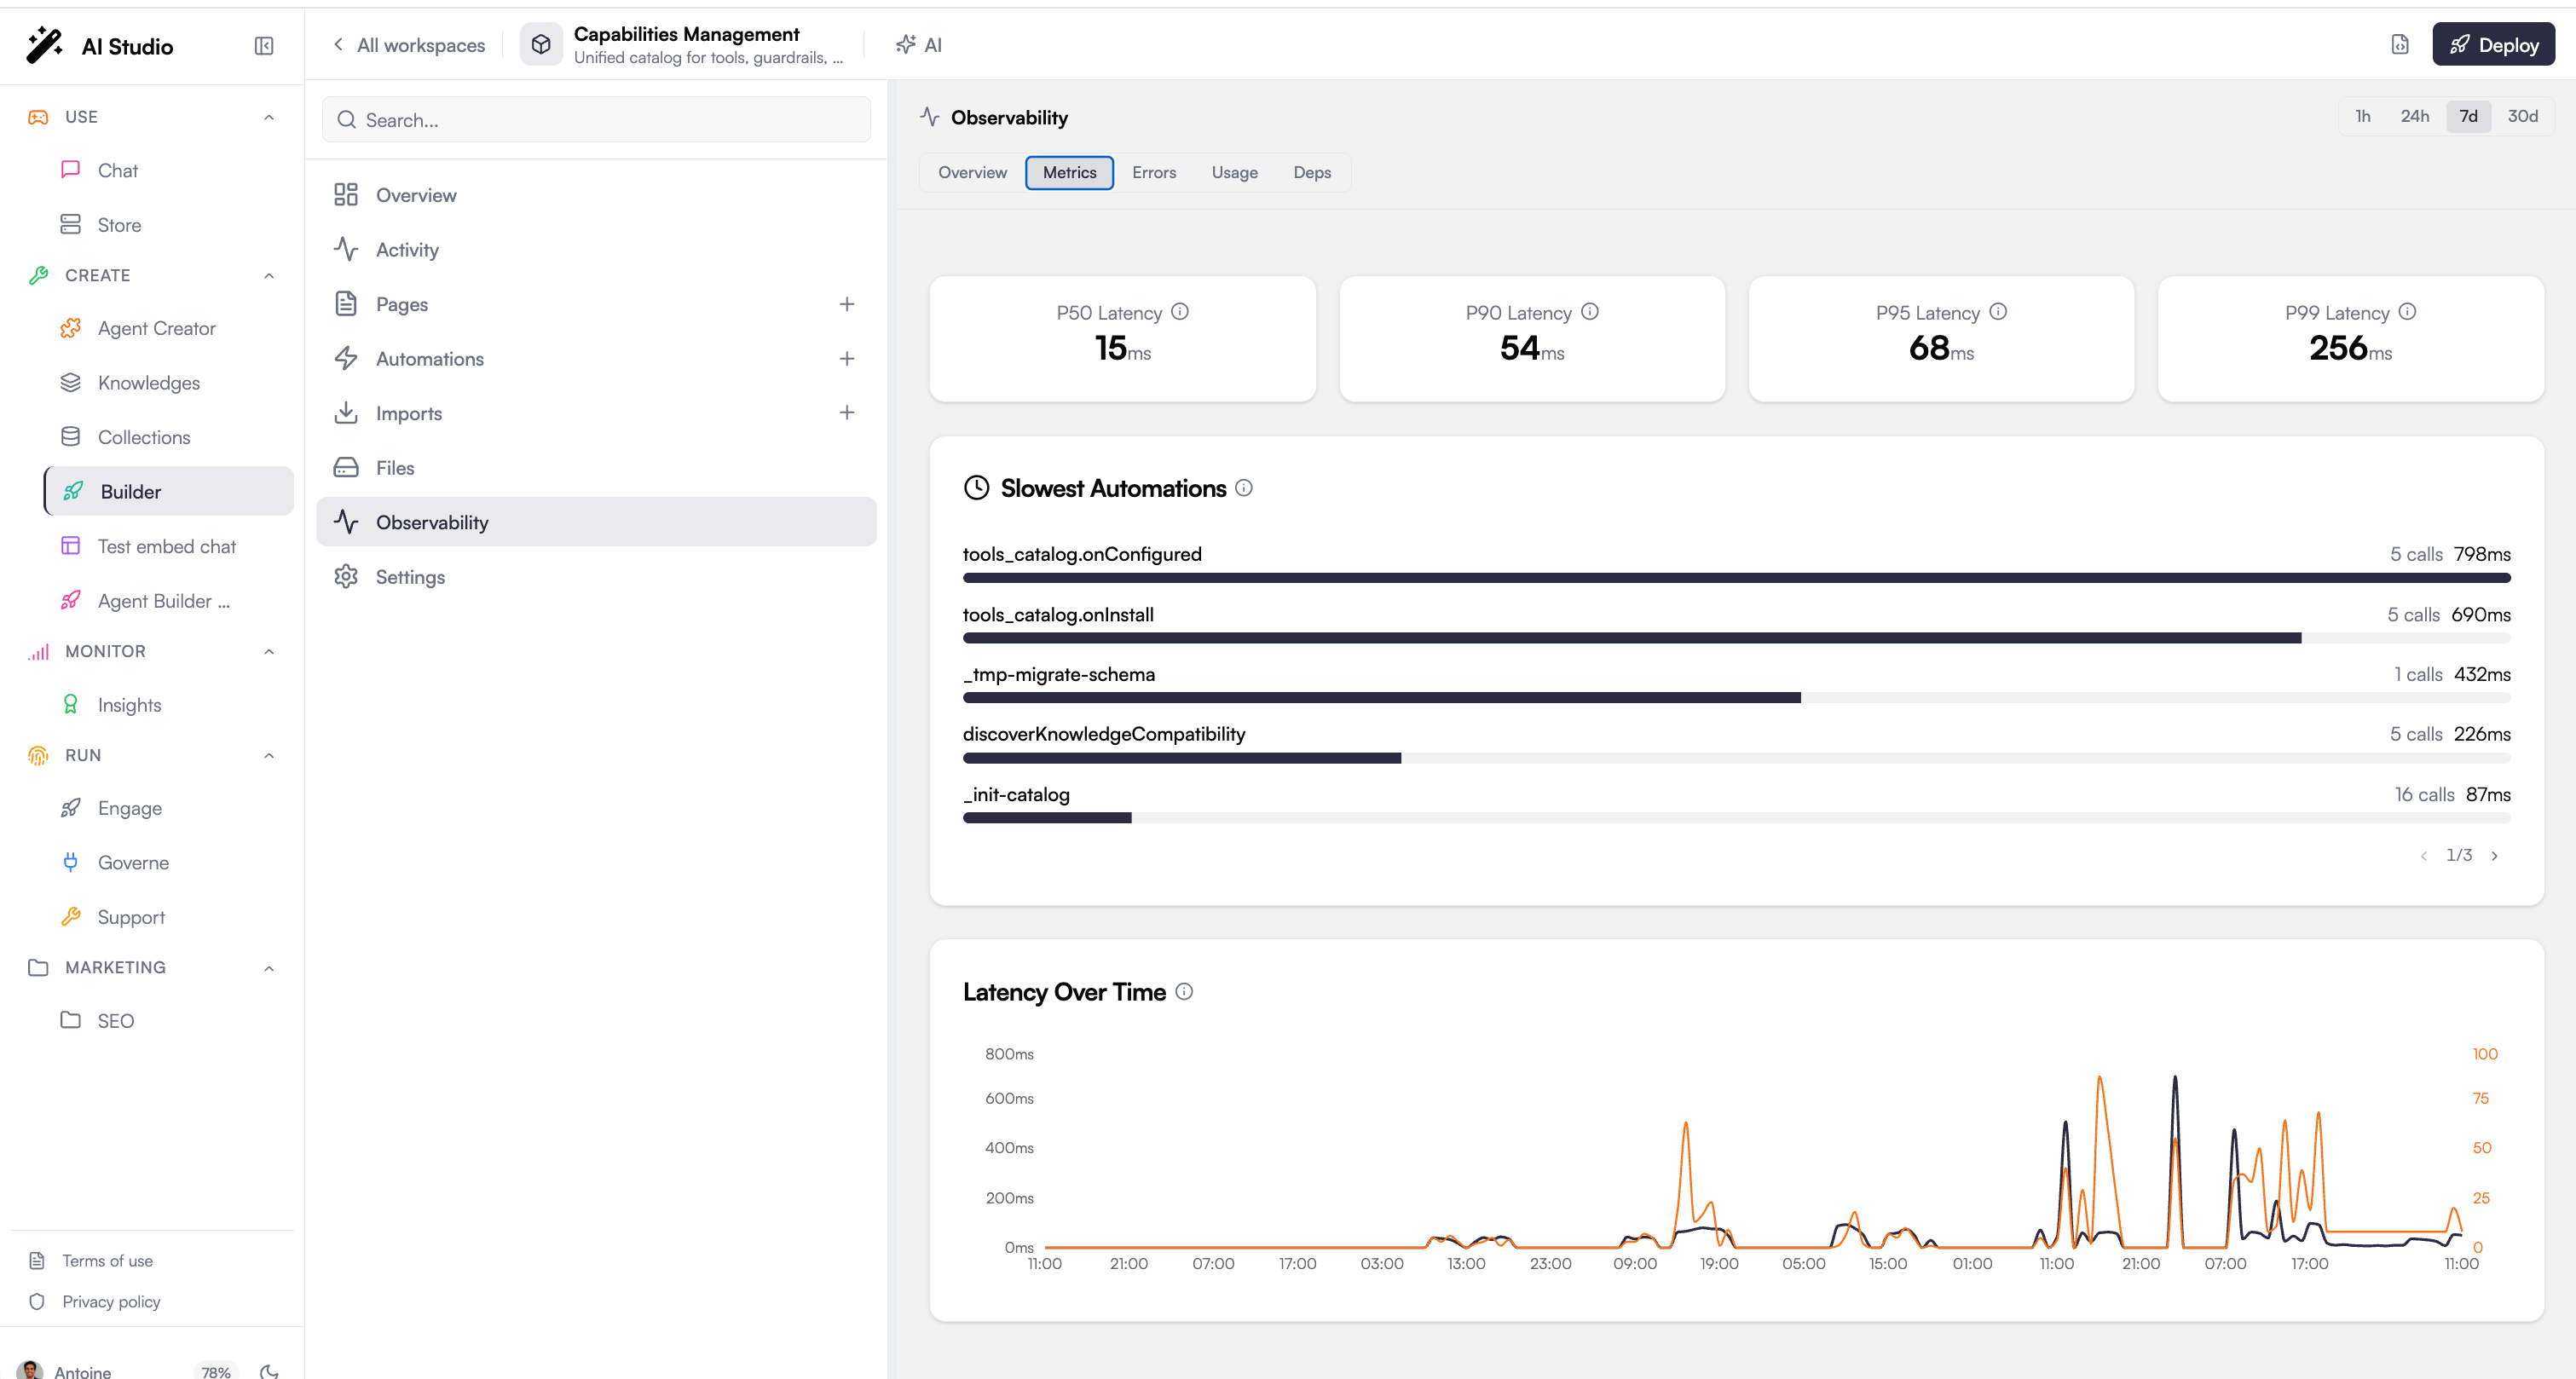
Latency-focused detail.
* Percentile cards: p50, p90, p95, and p99 latency.
* A **slowest automations** ranking.
* A **latency timeline** (p95 over time) with request volume overlaid.
## Period selector
A period selector in the header scopes every tab to one of four presets: **1h**, **24h**, **7d**, or **30d** (the default is 7d). Longer ranges are intentionally not offered here; the backend enforces its own server-side cap to keep long-range aggregation cheap.
## Tabs
Observability is organized into five tabs.
### Overview
A summary of the workspace's health for the selected period.
* A **health gauge** with a score and status.
* Quick stats: total interactions, error rate, p95 latency, and average requests per minute.
* A **latency distribution** chart.
* **Recent errors** (errors grouped by automation) and **top automations**.
### Metrics
Latency-focused detail.
* Percentile cards: p50, p90, p95, and p99 latency.
* A **slowest automations** ranking.
* A **latency timeline** (p95 over time) with request volume overlaid.
 ### Errors
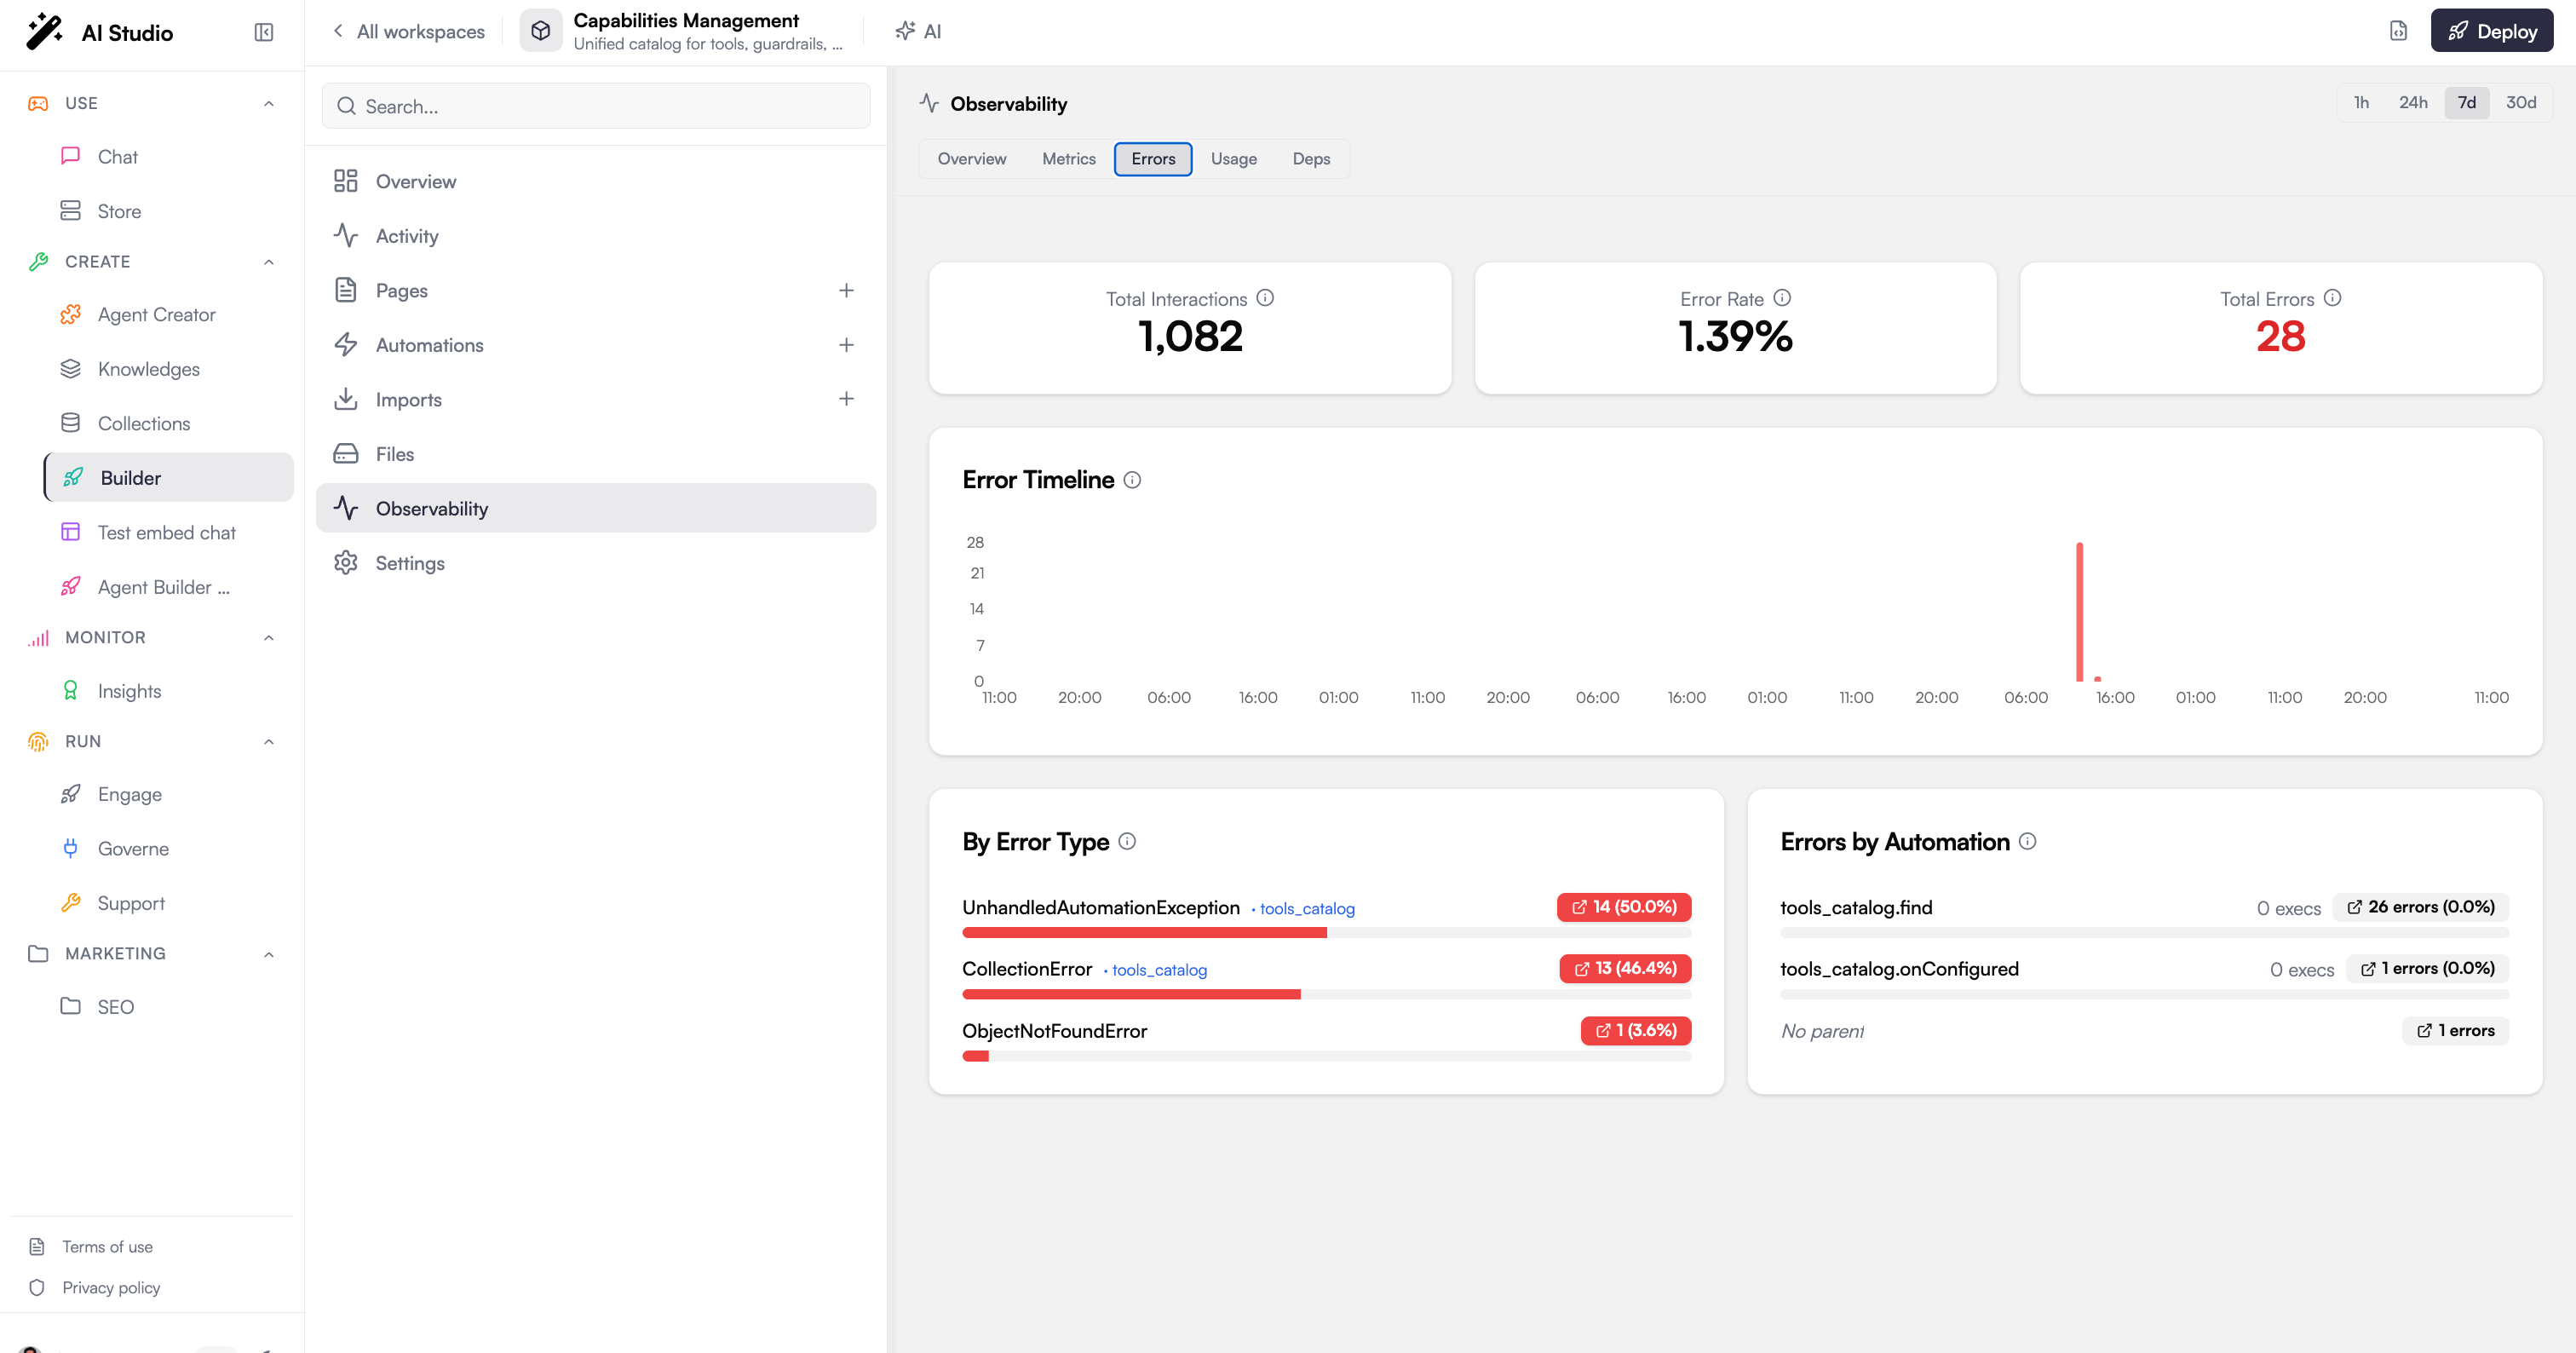
Everything error-related for the period.
* Stat cards: total interactions, error rate, and total errors.
* An **error timeline**.
* Errors broken down **by type** and **by automation**.
### Errors
Everything error-related for the period.
* Stat cards: total interactions, error rate, and total errors.
* An **error timeline**.
* Errors broken down **by type** and **by automation**.
 ### Usage
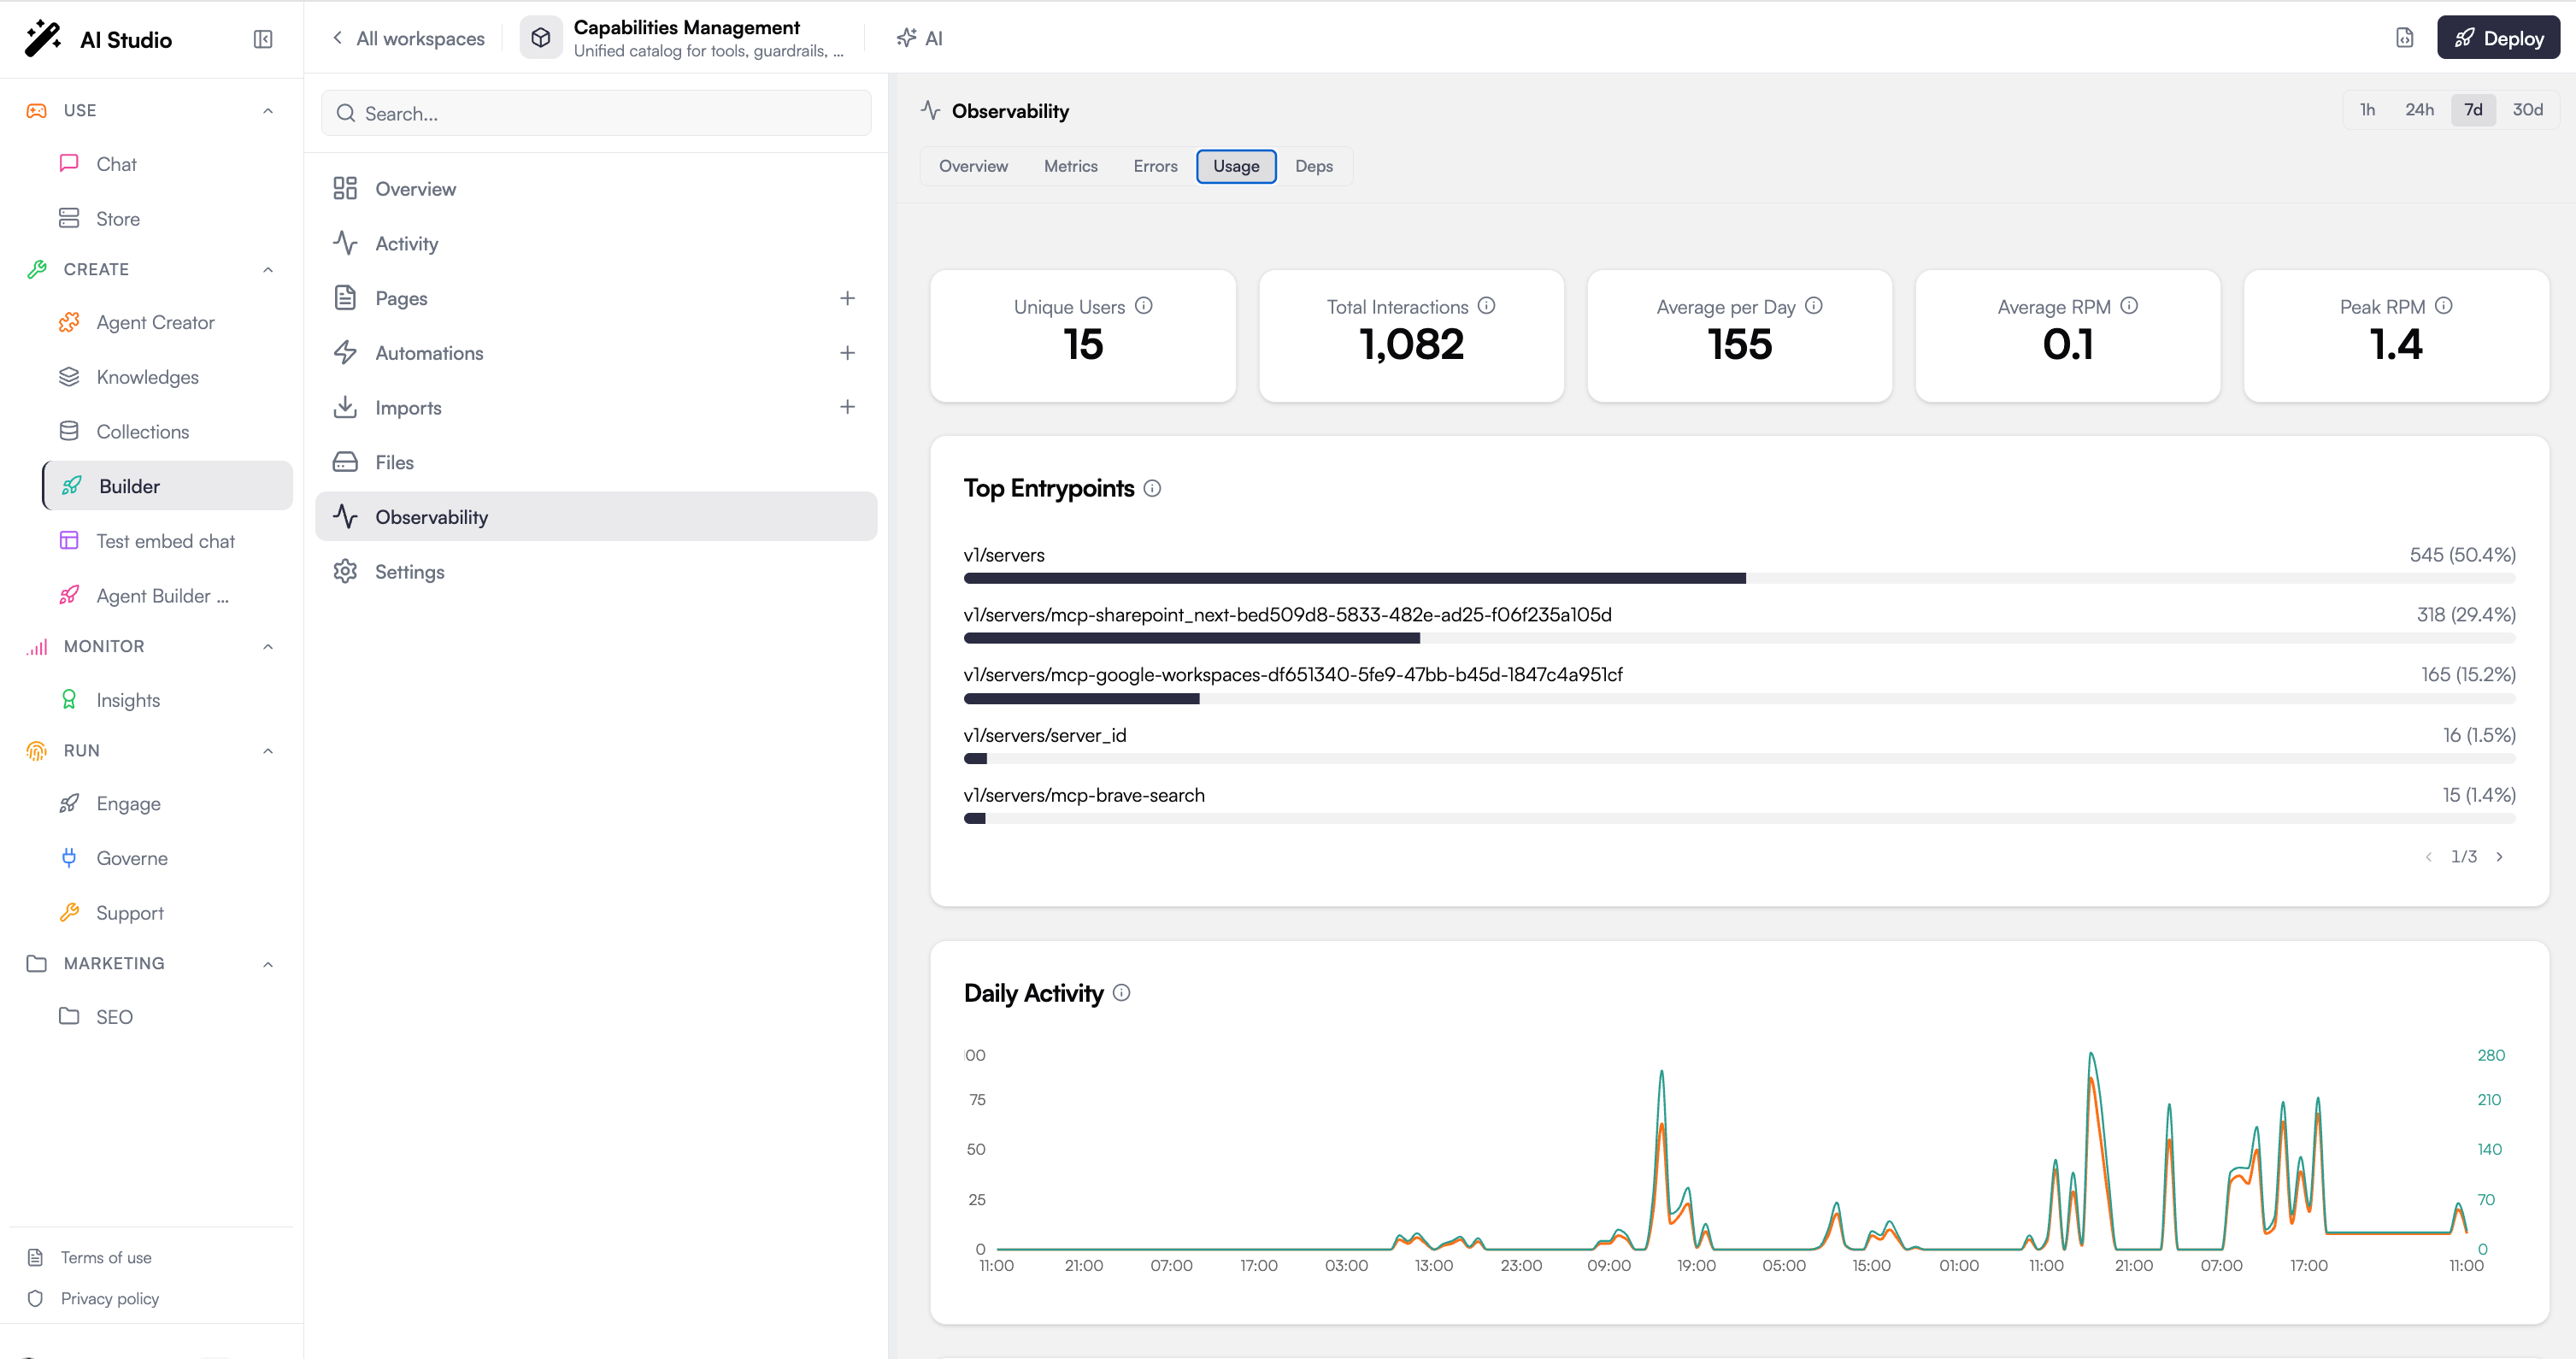
Who is using the workspace and how much.
* Stat cards: unique users, average interactions per day, and average and peak requests per minute.
* A **top entrypoints** ranking.
* A **daily activity** chart and a **users over time** chart.
### Usage
Who is using the workspace and how much.
* Stat cards: unique users, average interactions per day, and average and peak requests per minute.
* A **top entrypoints** ranking.
* A **daily activity** chart and a **users over time** chart.
 ### Dependencies
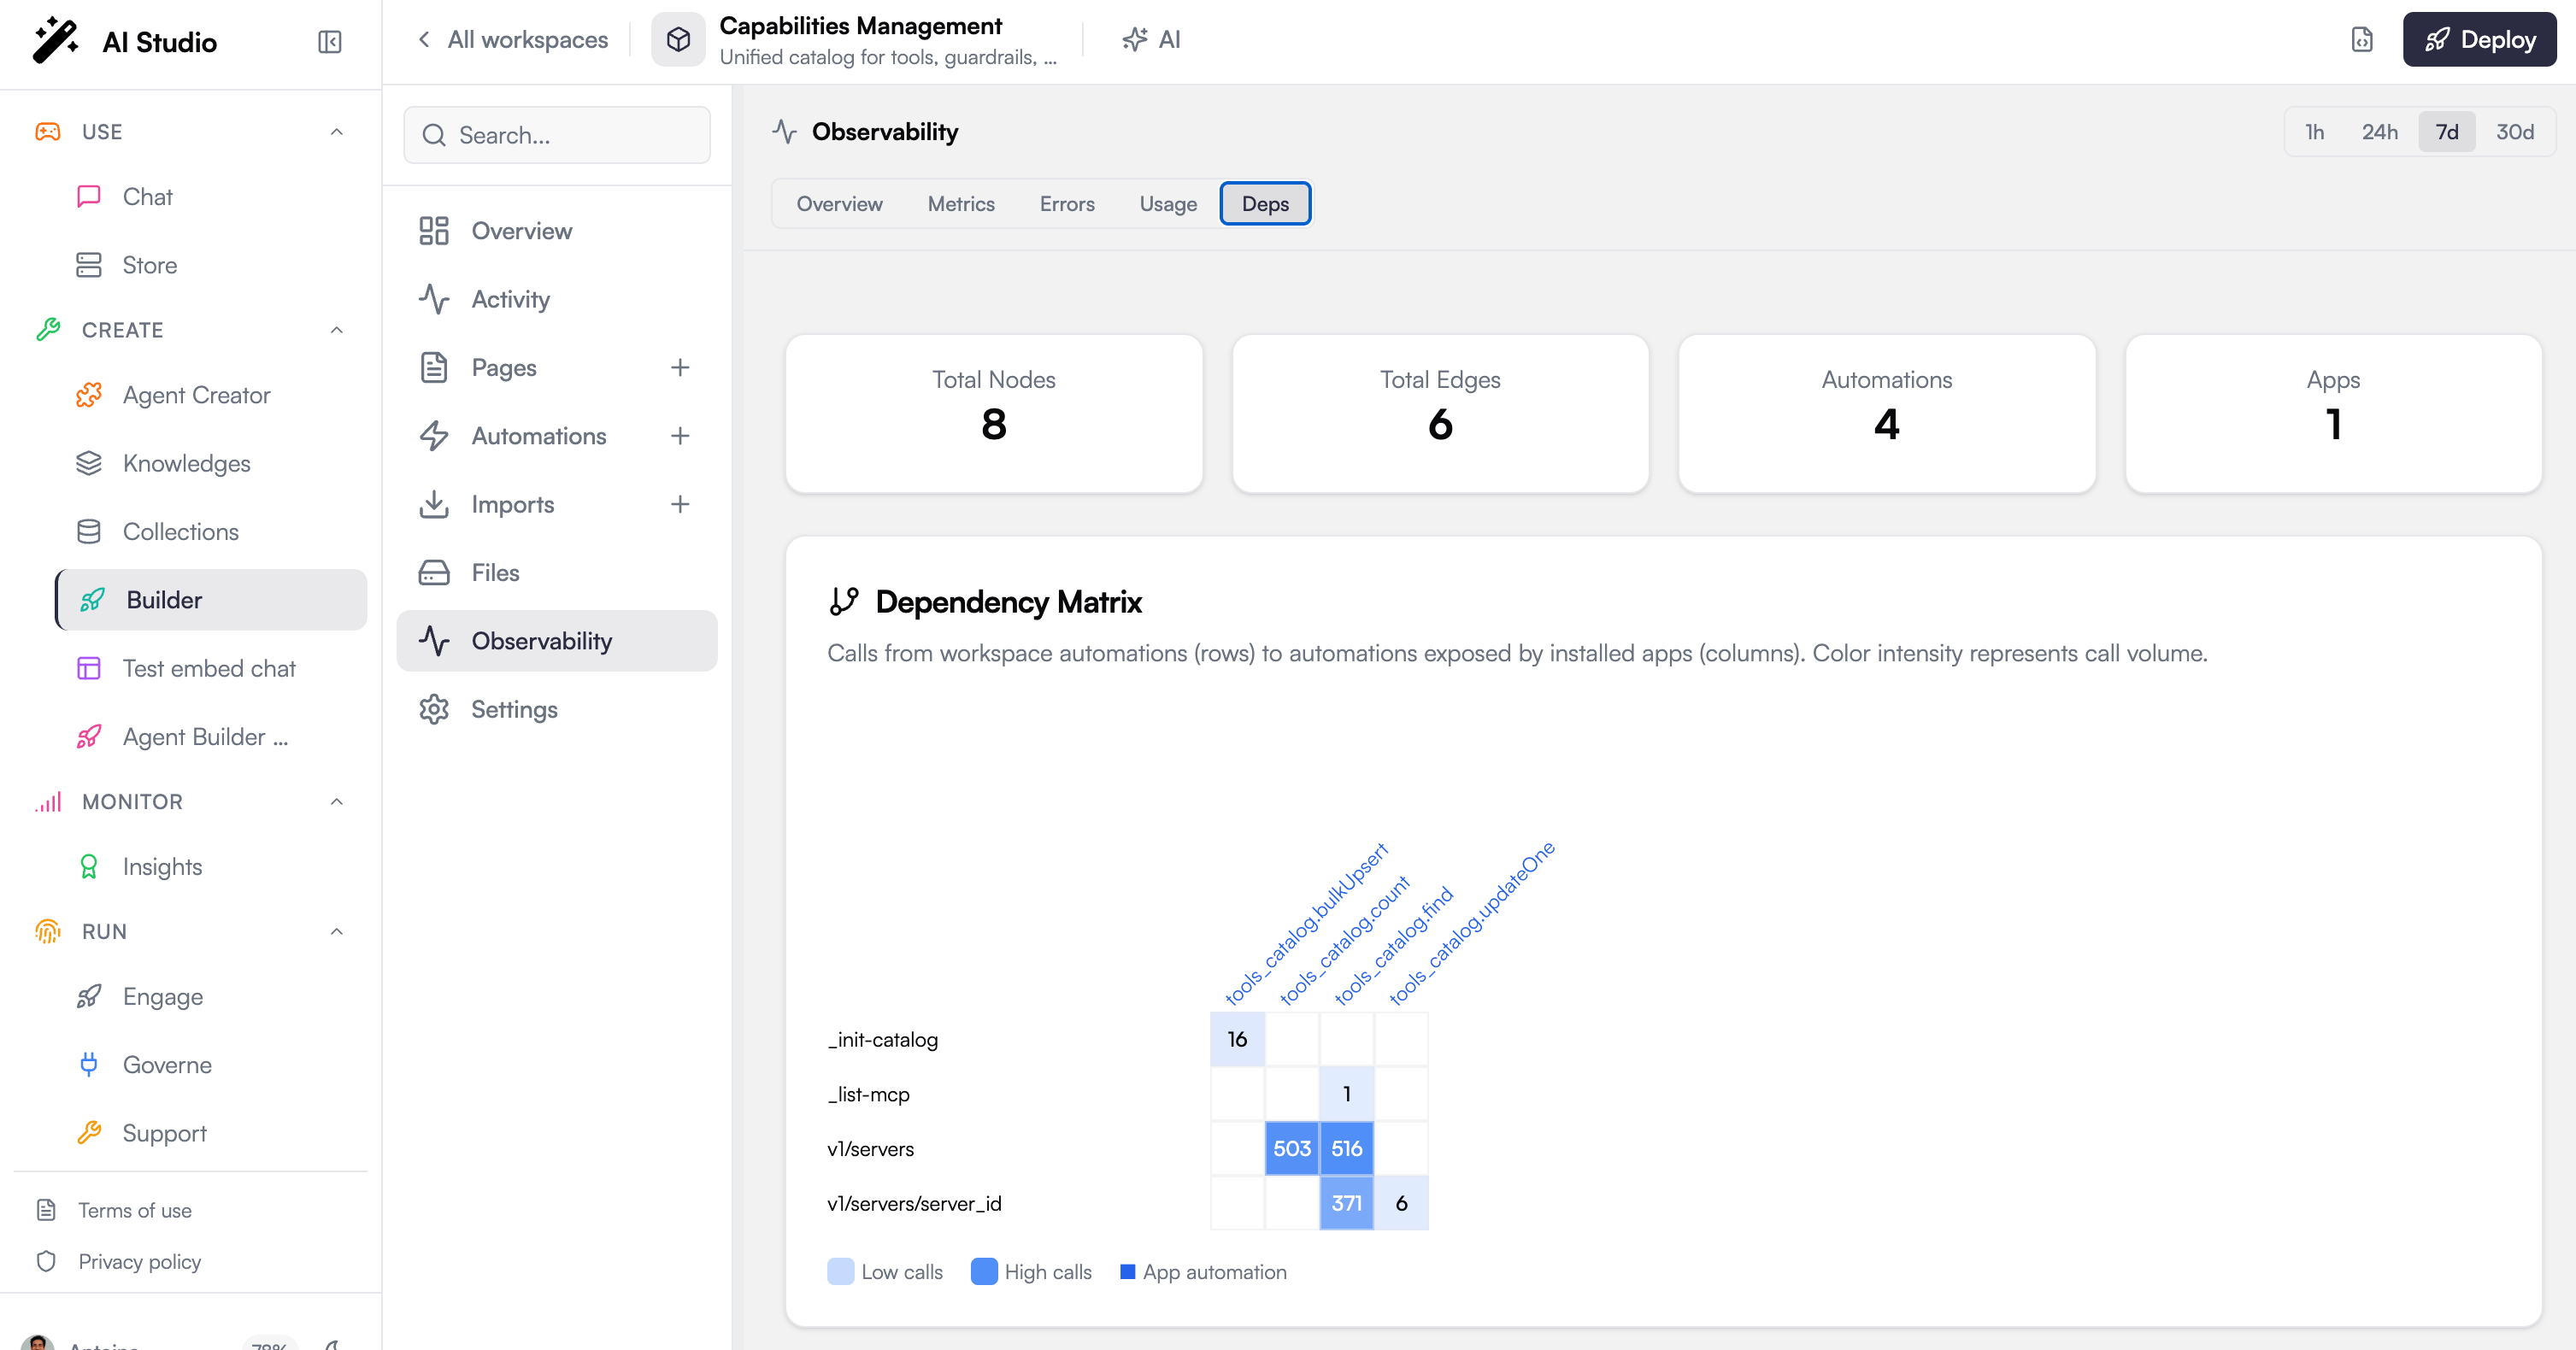
* A **dependency graph** of how the workspace's automations and installed apps call one another, with summary counts for nodes, edges, automations, and apps.
### Dependencies
* A **dependency graph** of how the workspace's automations and installed apps call one another, with summary counts for nodes, edges, automations, and apps.
 ## States
Observability can render a few non-dashboard states:
* **Not configured**: Observability is not set up for this workspace.
* **Not available yet**: Observability exists but has not been opened for this workspace (a permissions state).
* **Empty period**: there is no activity in the selected period yet; pick a wider period or come back once the workspace has run.
## Next steps
The raw event feed the observability charts link back to.
Trace a specific failure from an aggregate down to its events.
## States
Observability can render a few non-dashboard states:
* **Not configured**: Observability is not set up for this workspace.
* **Not available yet**: Observability exists but has not been opened for this workspace (a permissions state).
* **Empty period**: there is no activity in the selected period yet; pick a wider period or come back once the workspace has run.
## Next steps
The raw event feed the observability charts link back to.
Trace a specific failure from an aggregate down to its events.