> ## Documentation Index
> Fetch the complete documentation index at: https://docs.prisme.ai/llms.txt
> Use this file to discover all available pages before exploring further.
# Activity
> The per-workspace event feed with full-text search, field filters, correlation-ID trace views, and JSON export
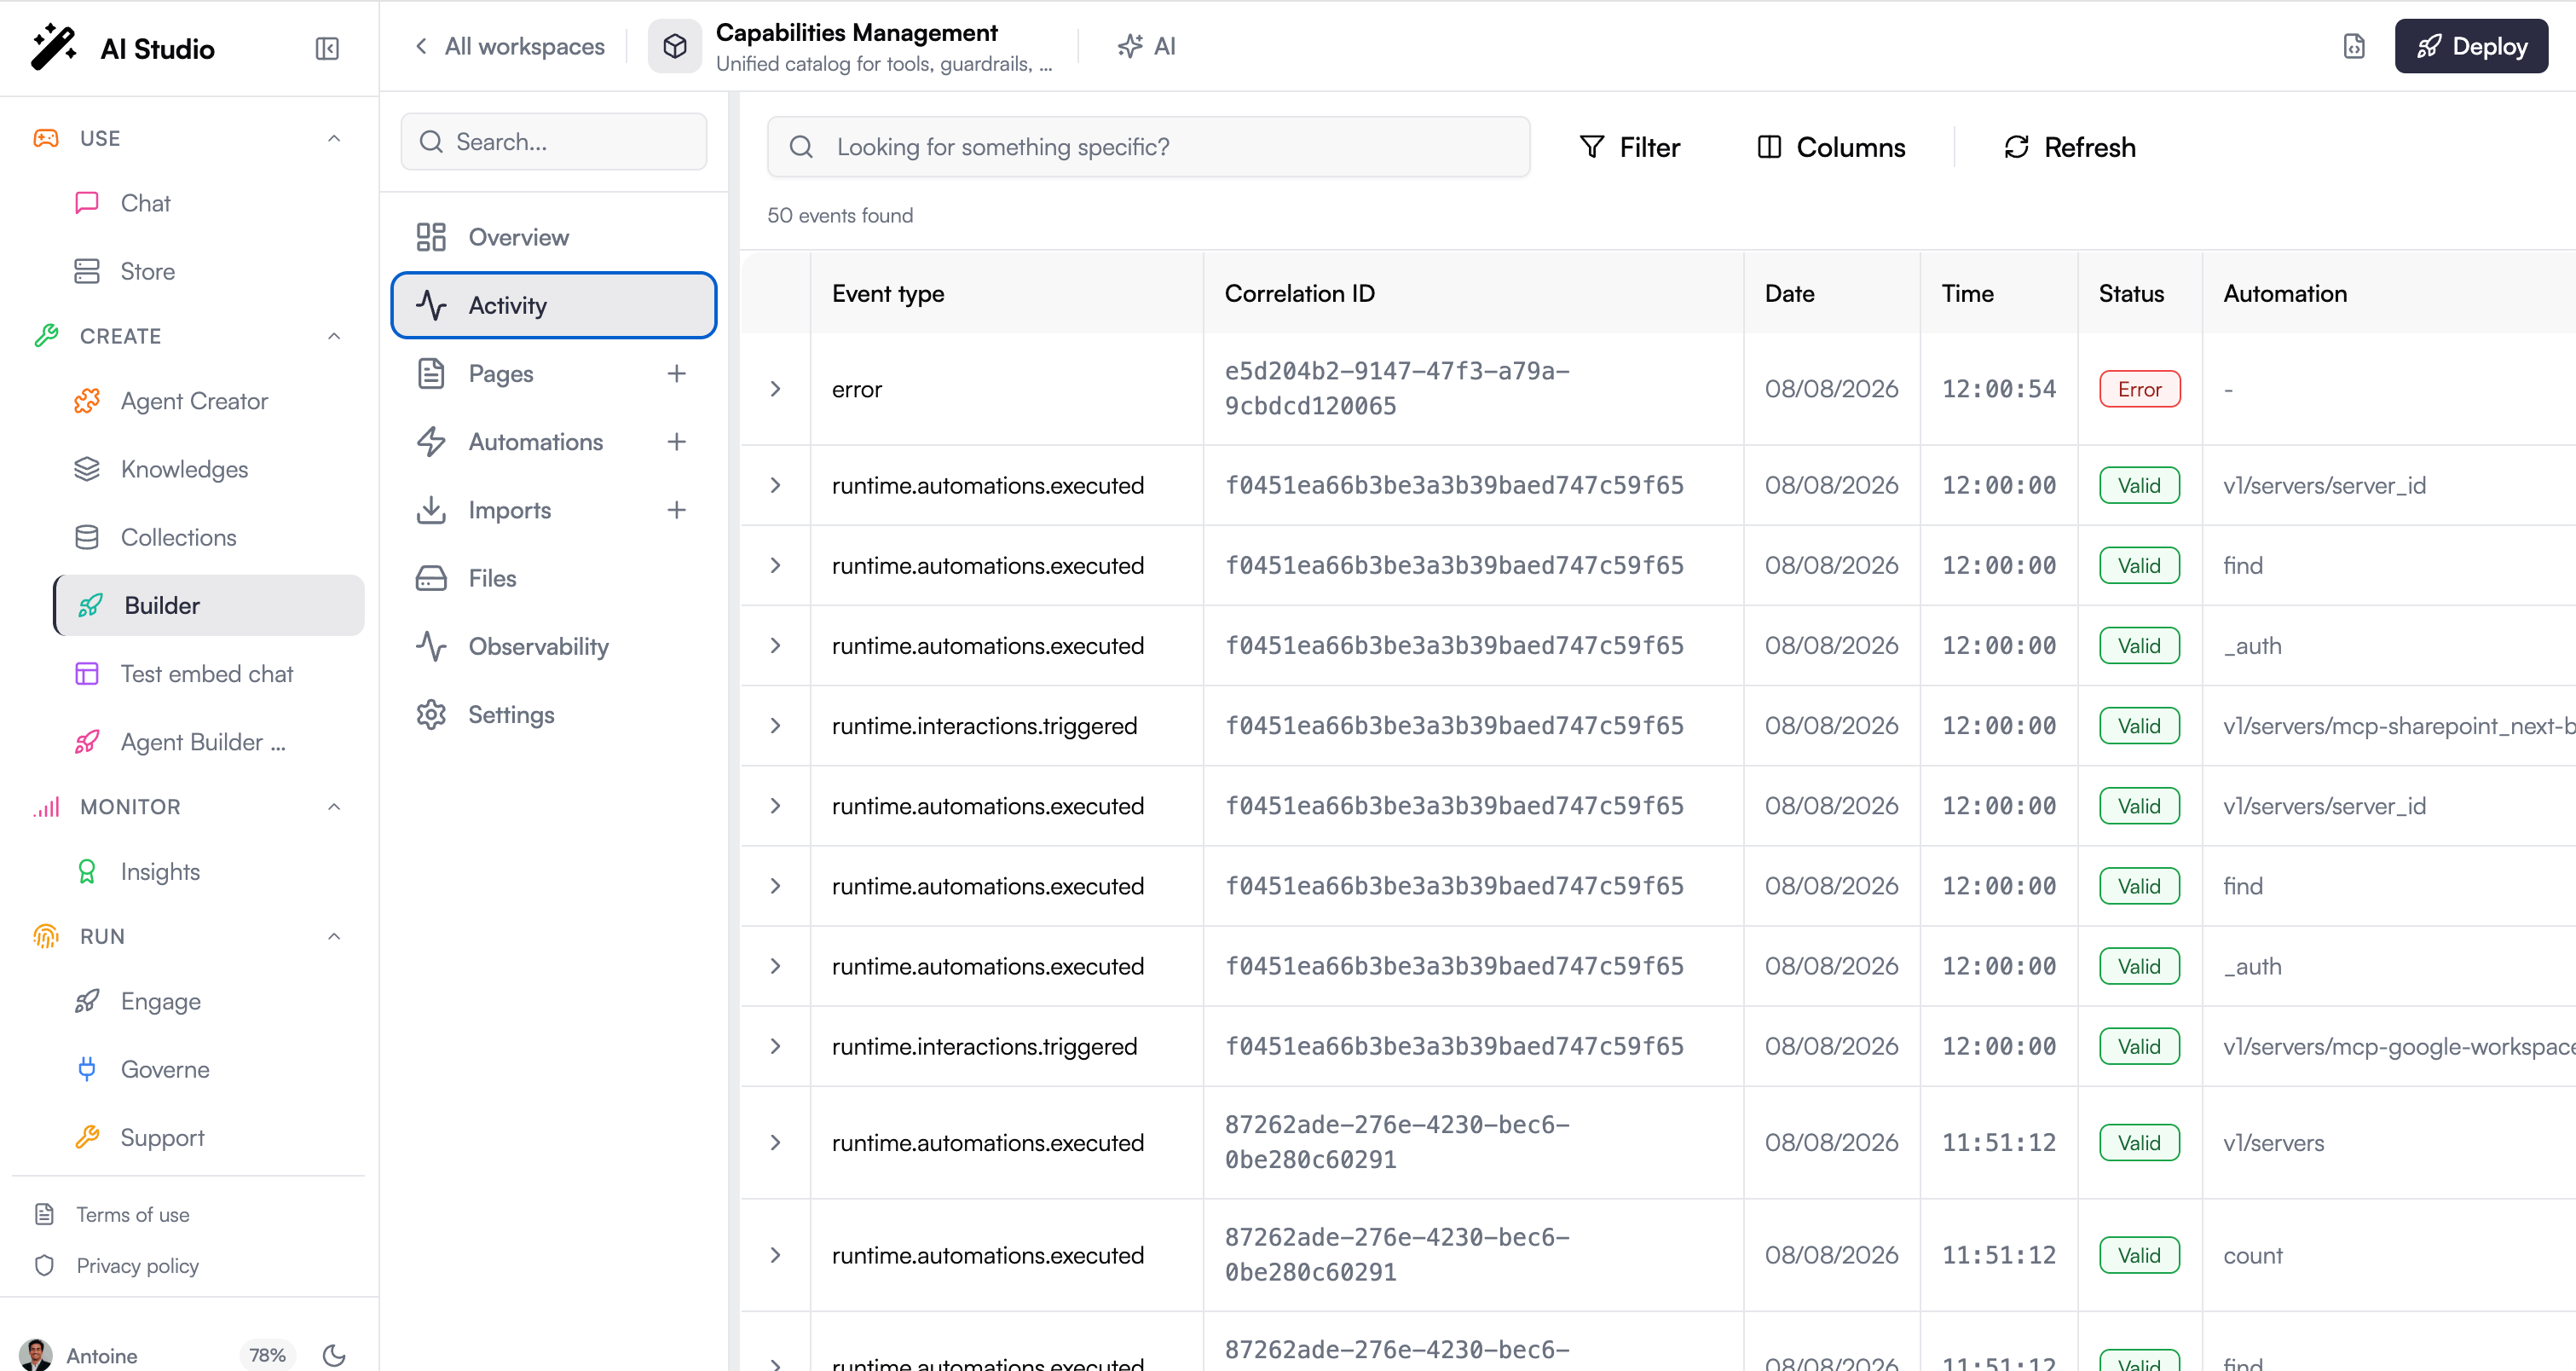
Activity is the raw event feed for a single workspace, reachable at `/builder/:id/activity`. It surfaces every event the workspace emits: API requests, webhook calls, automation runs, fetch calls, emitted events, and runtime errors, each with the metadata needed to reconstruct what happened.
Activity is what the workspace "events" feed is now called. It is the same per-workspace event view that previously lived in Governance, moved into Builder and scoped to the workspace you are editing.
 ## Search and filters
The header bar gives you three complementary ways to narrow the feed. Everything you set is persisted in the URL, so a filtered view is shareable and survives a reload.
* **Full-text search**: the search box matches free text across events.
* **Date range**: open **Filter** to reveal a from/to datetime range.
* **Custom field filters**: add one or more `field:value` rows to match on specific event fields.
Click **Filter** to open the filter panel, then **Add specific field** to add a field filter. **Reset filters** clears search, date range, and all field filters at once. A badge on the **Filter** button shows how many filters are currently active.
### Known filter fields
You can filter on any event field, but these are the fields Activity recognizes and restores from the URL:
| Field | Matches |
| ---------------------------- | ---------------------------------------------------------------- |
| `source.correlationId` | Events sharing one trigger chain (unlocks trace mode; see below) |
| `source.sessionId` | Events from one user session |
| `source.userId` | Events emitted by one user |
| `source.automationSlug` | Events from one automation |
| `source.appInstanceFullSlug` | Events from one installed app instance |
| `source.appInstanceDepth` | Events at a given app-nesting depth |
| `type` | A single event type (supports patterns such as `workspaces.*`) |
| `types` | A comma-separated list of event types |
| `id` | A single event by ID |
### Filter presets
The **Filter suggestions** popover offers ready-made filter sets for common questions:
| Preset | Focuses on |
| --------------------- | ---------------------------------------------------- |
| **Errors** | Error and failed-fetch events |
| **Webhook calls** | Interactions triggered by an endpoint |
| **Workspace editing** | `workspaces.*` edit events |
| **Sharing** | Permission and sharing events |
| **User events** | Events emitted by a user |
| **My Activity** | Events emitted by you (shown when you are signed in) |
| **Interactions** | `runtime.interactions.triggered` events |
| **Deep calls** | Events emitted from nested app calls |
Applying a preset replaces the current field filters and opens the filter panel so you can see and adjust what it set.
## Search and filters
The header bar gives you three complementary ways to narrow the feed. Everything you set is persisted in the URL, so a filtered view is shareable and survives a reload.
* **Full-text search**: the search box matches free text across events.
* **Date range**: open **Filter** to reveal a from/to datetime range.
* **Custom field filters**: add one or more `field:value` rows to match on specific event fields.
Click **Filter** to open the filter panel, then **Add specific field** to add a field filter. **Reset filters** clears search, date range, and all field filters at once. A badge on the **Filter** button shows how many filters are currently active.
### Known filter fields
You can filter on any event field, but these are the fields Activity recognizes and restores from the URL:
| Field | Matches |
| ---------------------------- | ---------------------------------------------------------------- |
| `source.correlationId` | Events sharing one trigger chain (unlocks trace mode; see below) |
| `source.sessionId` | Events from one user session |
| `source.userId` | Events emitted by one user |
| `source.automationSlug` | Events from one automation |
| `source.appInstanceFullSlug` | Events from one installed app instance |
| `source.appInstanceDepth` | Events at a given app-nesting depth |
| `type` | A single event type (supports patterns such as `workspaces.*`) |
| `types` | A comma-separated list of event types |
| `id` | A single event by ID |
### Filter presets
The **Filter suggestions** popover offers ready-made filter sets for common questions:
| Preset | Focuses on |
| --------------------- | ---------------------------------------------------- |
| **Errors** | Error and failed-fetch events |
| **Webhook calls** | Interactions triggered by an endpoint |
| **Workspace editing** | `workspaces.*` edit events |
| **Sharing** | Permission and sharing events |
| **User events** | Events emitted by a user |
| **My Activity** | Events emitted by you (shown when you are signed in) |
| **Interactions** | `runtime.interactions.triggered` events |
| **Deep calls** | Events emitted from nested app calls |
Applying a preset replaces the current field filters and opens the filter panel so you can see and adjust what it set.
 ## Table columns
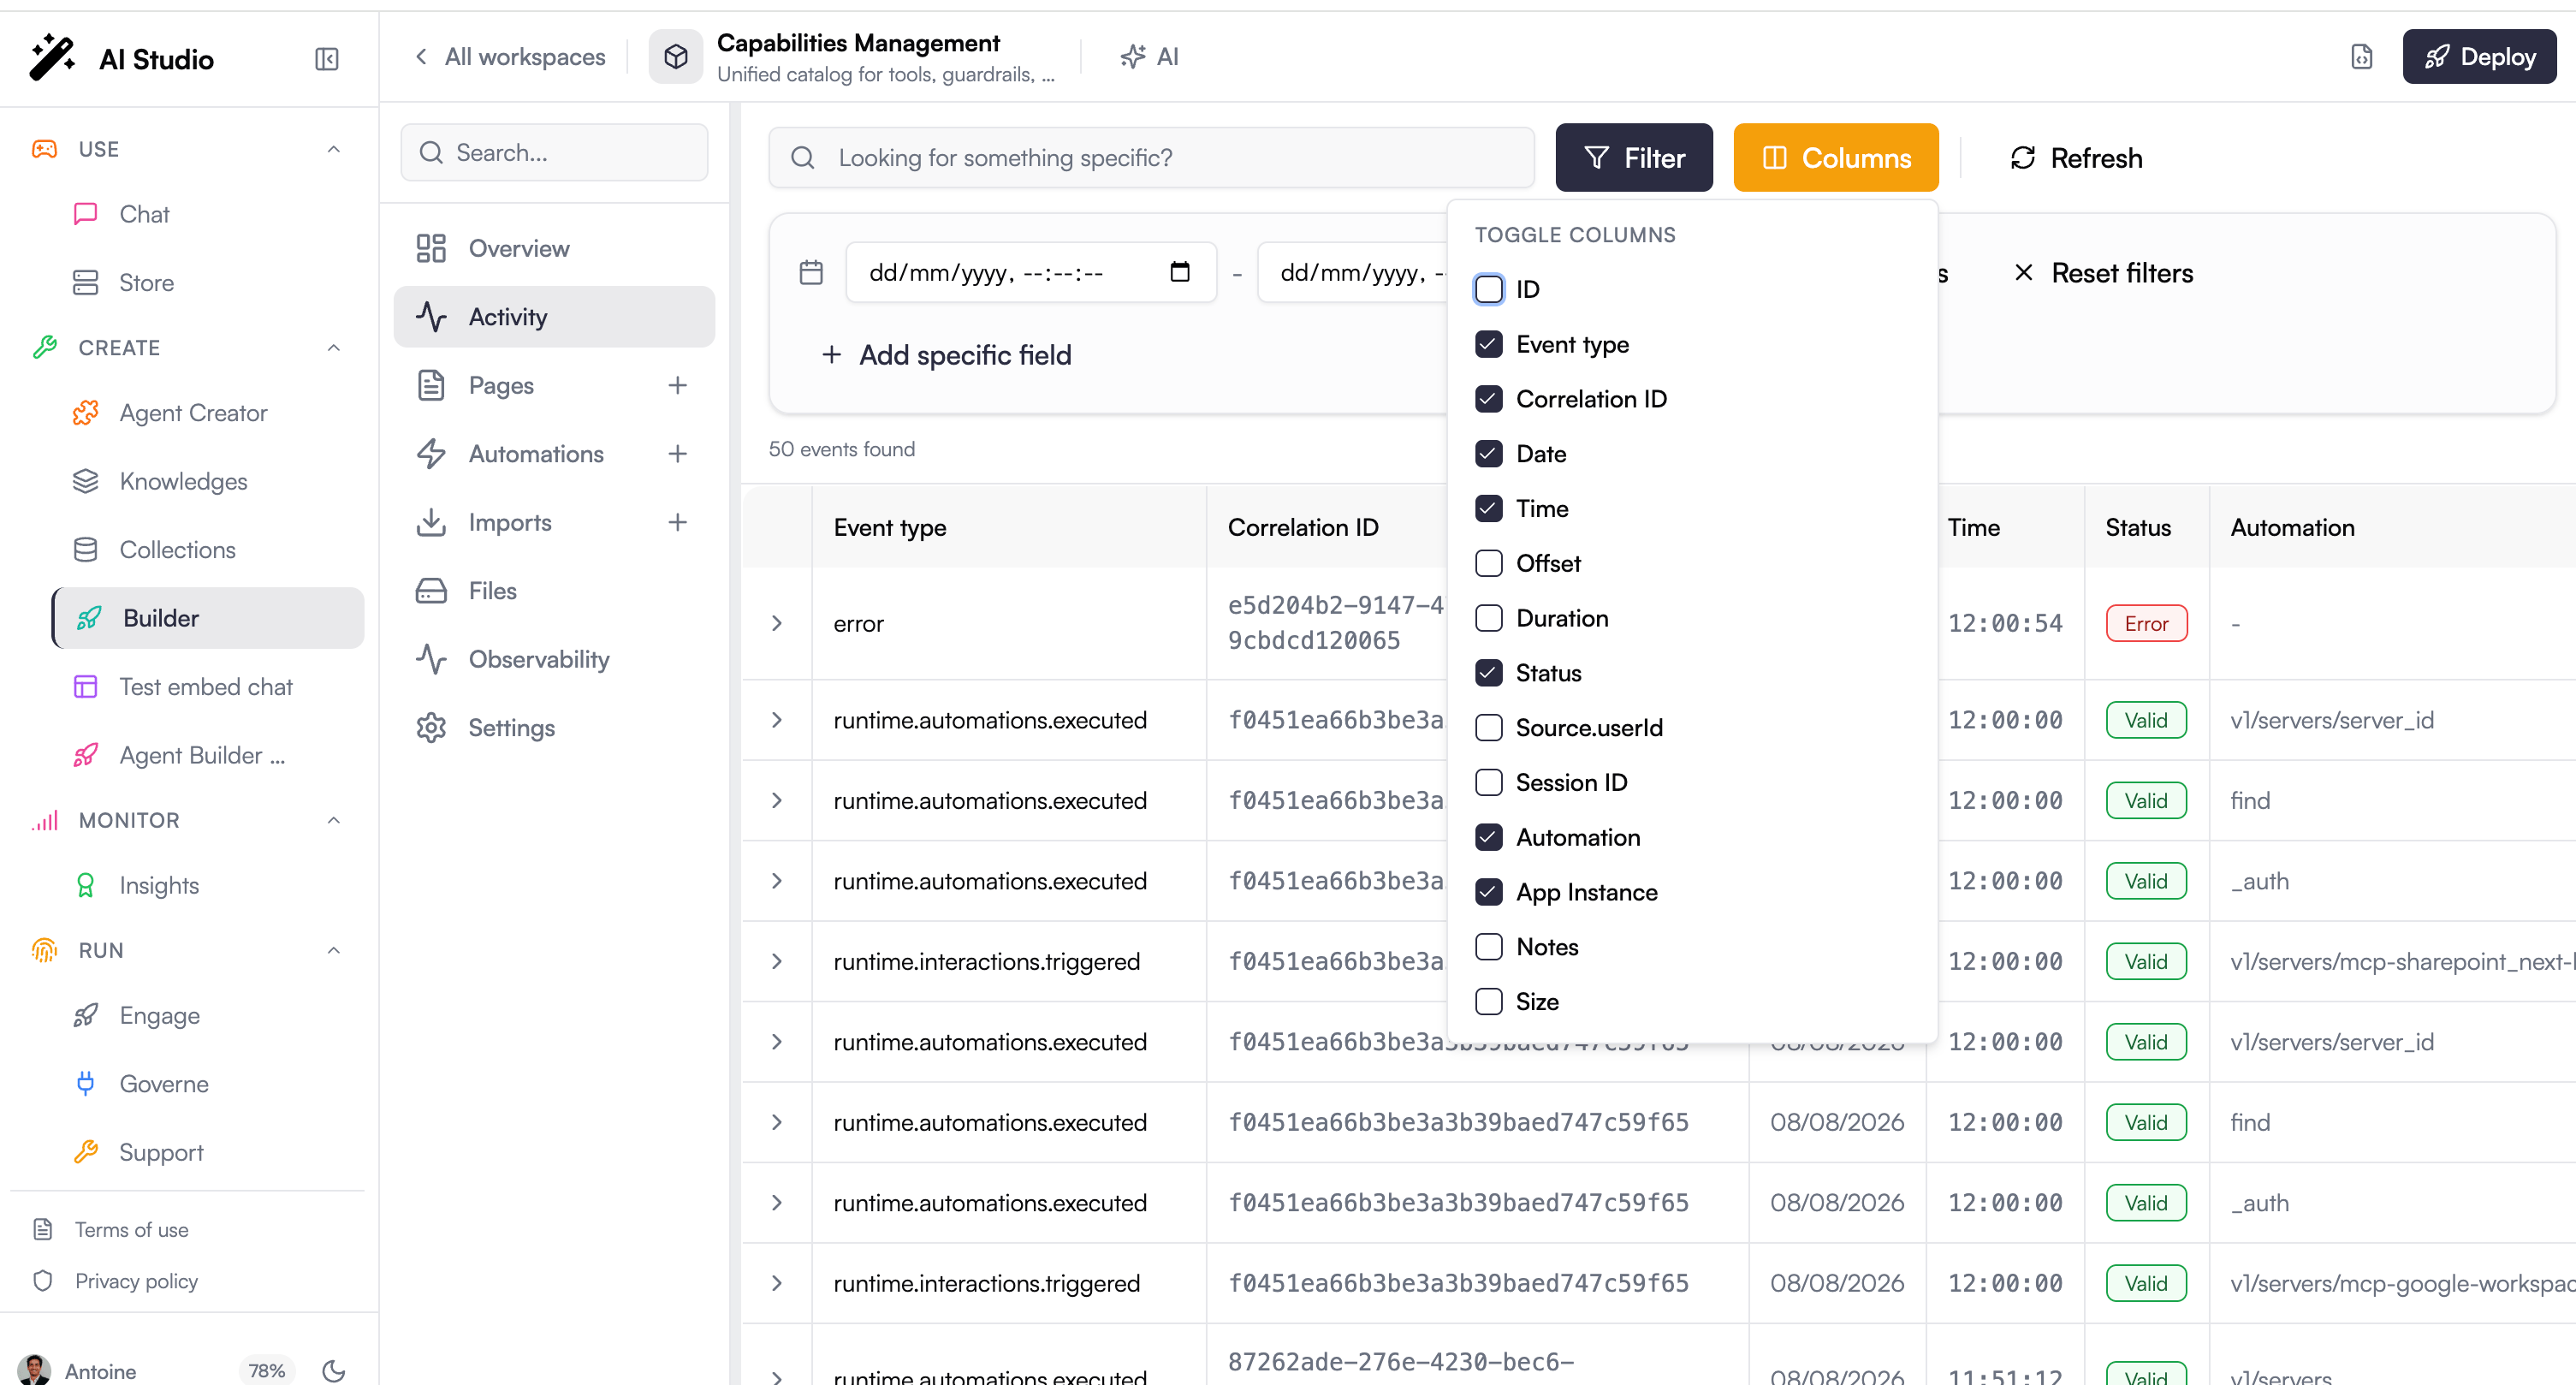
The feed renders as a table. Use the **Columns** dropdown to toggle which columns are visible. Available columns are: ID, Event type, Correlation ID, Date, Time, Offset, Duration, Status, Source.userId, Session ID, Automation, App Instance, Notes, and Size. Event type, Correlation ID, Date, Time, Status, Automation, and App Instance are shown by default.
Each row expands to reveal the full event, including its payload and source metadata.
## Trace mode (correlation ID)
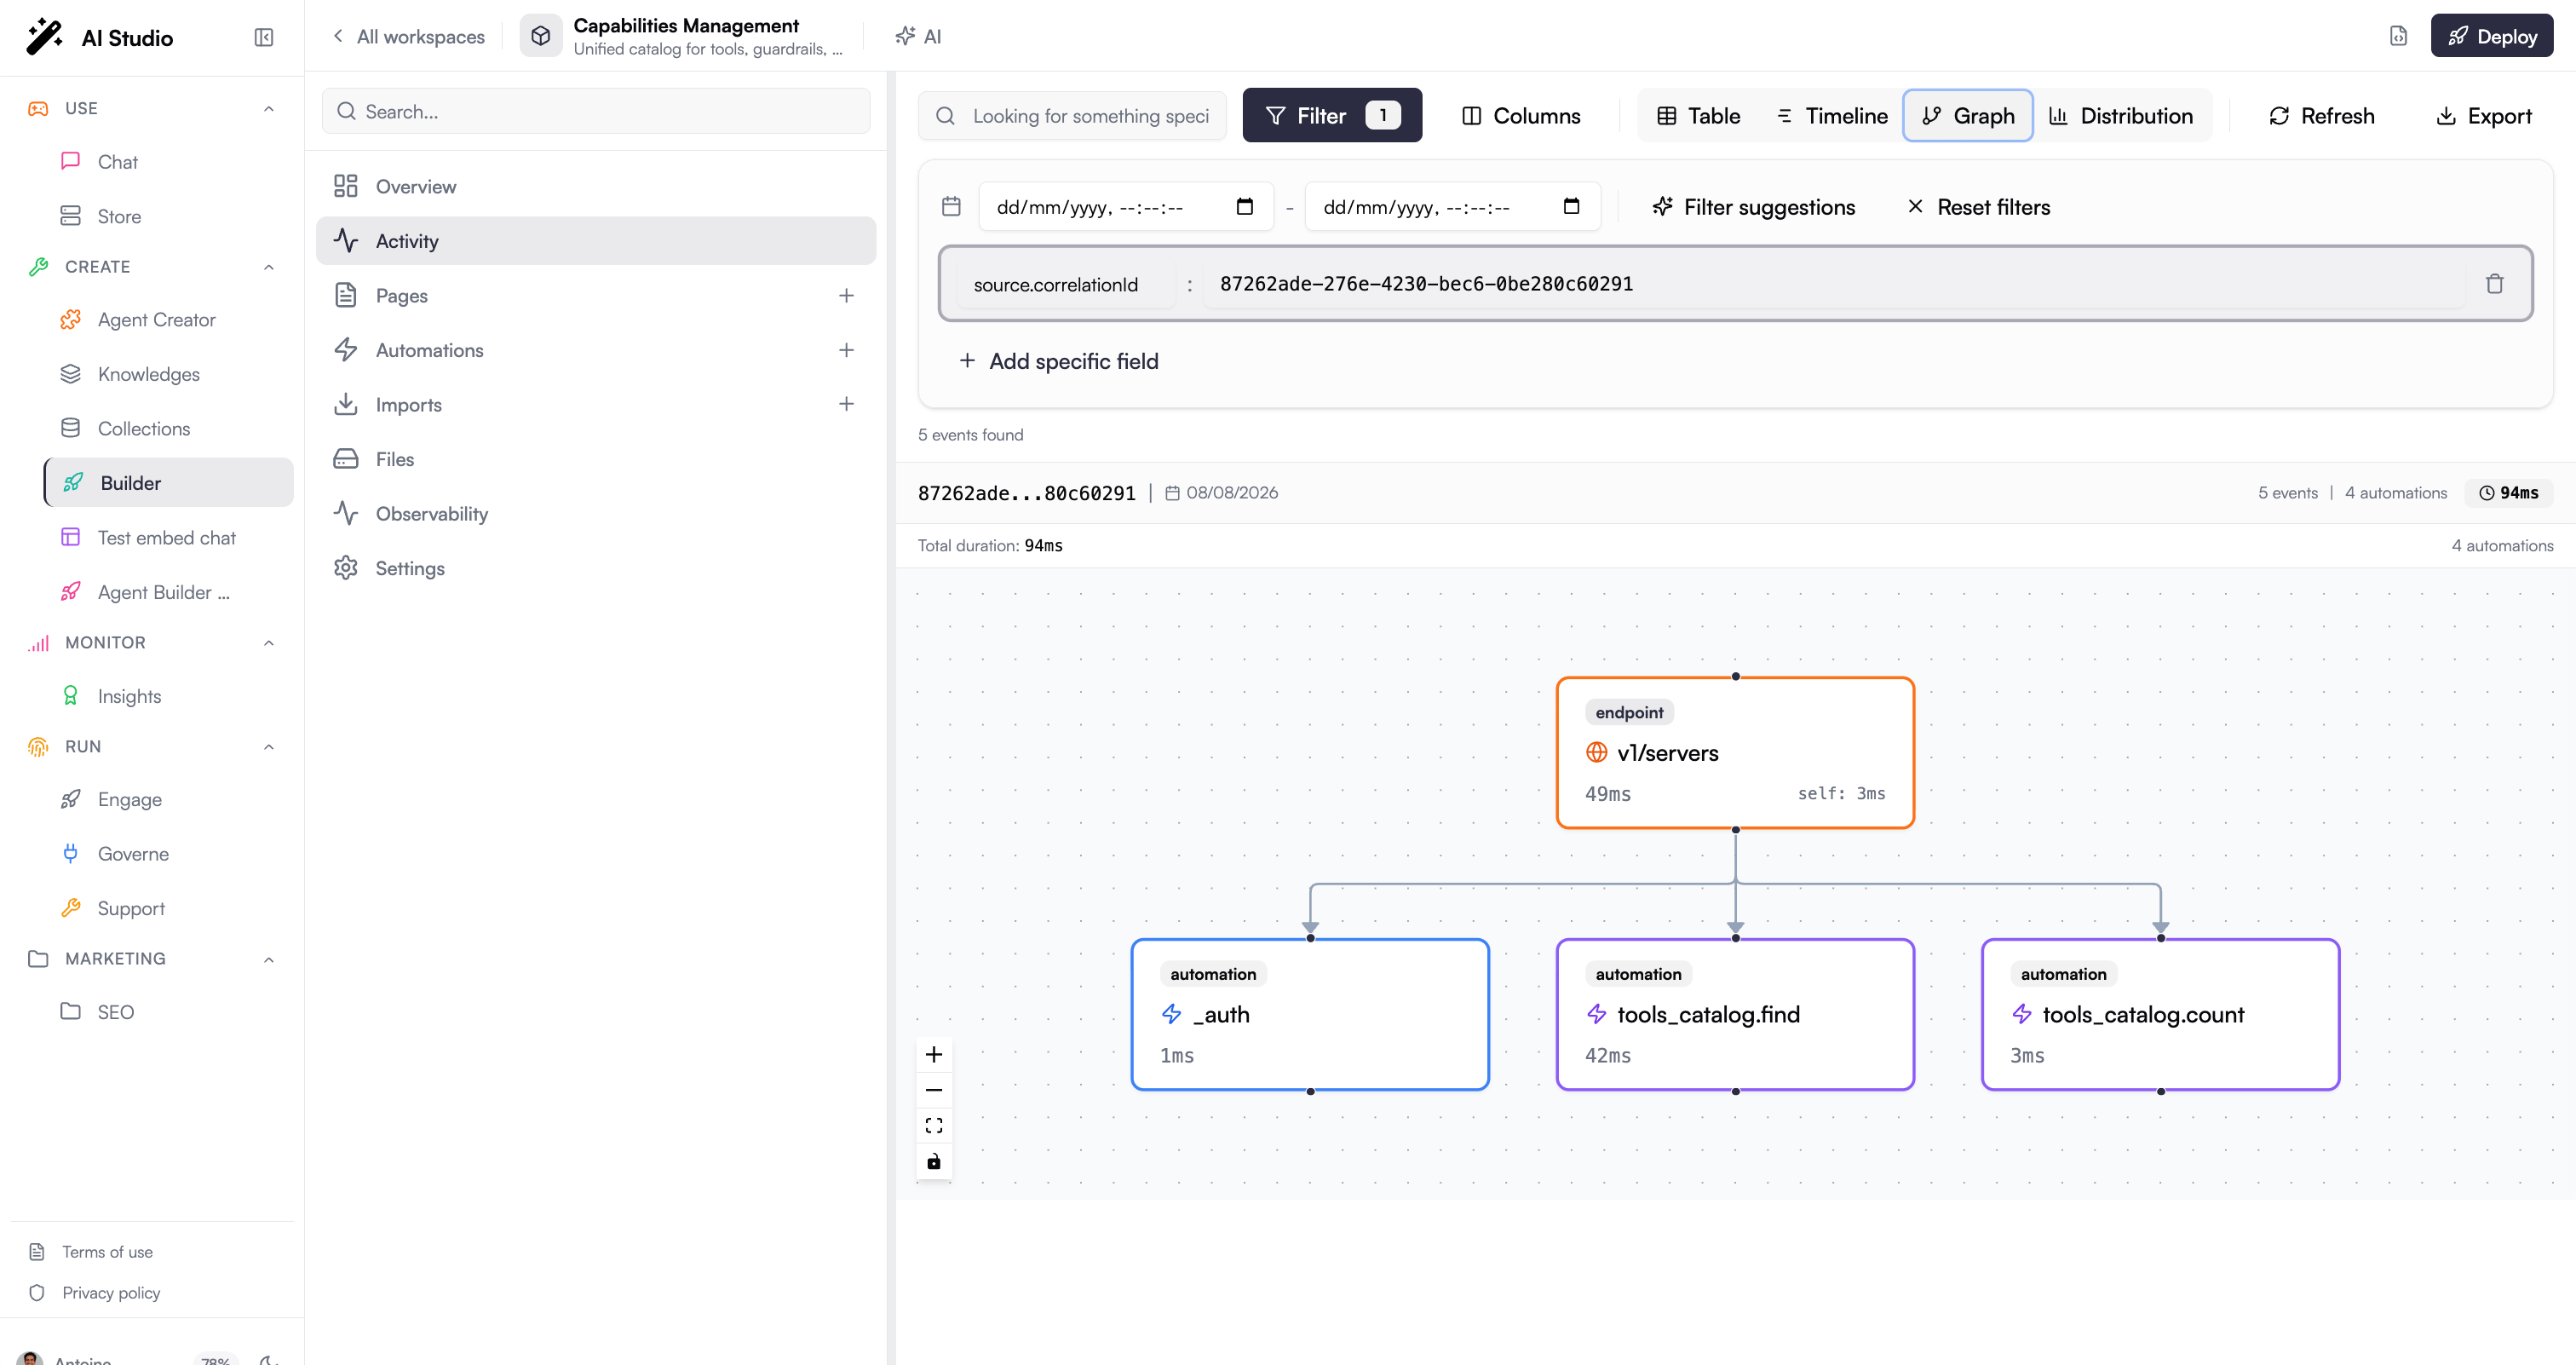
When a `source.correlationId` filter is active, Activity unlocks a trace mode: a view selector appears with four ways to read the same correlated event set.
| View | What it shows |
| ---------------- | ----------------------------------------------------------------------- |
| **Table** | The correlated events as rows |
| **Timeline** | The events laid out on a time axis so you can see ordering and duration |
| **Graph** | The call relationships between events as a graph |
| **Distribution** | How time is distributed across the trace |
A **Trace Summary** header sits above the views and rolls up the trace at a glance: total duration, event count, automation count, error count, and, when present, the agent, model, and prompt / completion / total token counts.
## Table columns
The feed renders as a table. Use the **Columns** dropdown to toggle which columns are visible. Available columns are: ID, Event type, Correlation ID, Date, Time, Offset, Duration, Status, Source.userId, Session ID, Automation, App Instance, Notes, and Size. Event type, Correlation ID, Date, Time, Status, Automation, and App Instance are shown by default.
Each row expands to reveal the full event, including its payload and source metadata.
## Trace mode (correlation ID)
When a `source.correlationId` filter is active, Activity unlocks a trace mode: a view selector appears with four ways to read the same correlated event set.
| View | What it shows |
| ---------------- | ----------------------------------------------------------------------- |
| **Table** | The correlated events as rows |
| **Timeline** | The events laid out on a time axis so you can see ordering and duration |
| **Graph** | The call relationships between events as a graph |
| **Distribution** | How time is distributed across the trace |
A **Trace Summary** header sits above the views and rolls up the trace at a glance: total duration, event count, automation count, error count, and, when present, the agent, model, and prompt / completion / total token counts.
 For a step-by-step debugging walkthrough using correlation IDs and these views, see [Testing & Debugging](/products/ai-builder/testing-debugging).
## Export
When a filter is active, an **Export** button downloads the currently loaded events as a JSON file. Each exported event includes its ID, type, status, date, time, user ID, session ID, correlation ID, automation slug, and payload.
## Loading more
The feed loads in pages of 50 events. Use **Load more** at the bottom of the table to fetch the next page, and **Refresh** in the header to re-fetch from the top with the current filters applied. A results count shows how many events match.
## Next steps
Aggregated health, metrics, errors, usage, and dependencies for the workspace.
Debug a failed run with correlation IDs and trace views.
For a step-by-step debugging walkthrough using correlation IDs and these views, see [Testing & Debugging](/products/ai-builder/testing-debugging).
## Export
When a filter is active, an **Export** button downloads the currently loaded events as a JSON file. Each exported event includes its ID, type, status, date, time, user ID, session ID, correlation ID, automation slug, and payload.
## Loading more
The feed loads in pages of 50 events. Use **Load more** at the bottom of the table to fetch the next page, and **Refresh** in the header to re-fetch from the top with the current filters applied. A results count shows how many events match.
## Next steps
Aggregated health, metrics, errors, usage, and dependencies for the workspace.
Debug a failed run with correlation IDs and trace views.